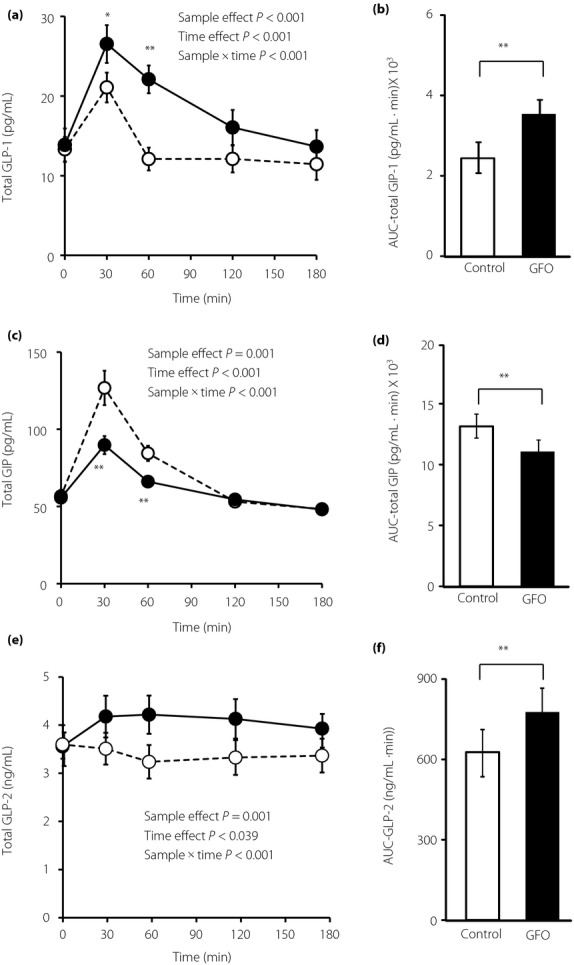
Figure 2.

Incretin and glucagon-like peptide-2 (GLP-2) levels during oligosaccharide (GFO) and glucose tolerance. Total (a) glucagon-like peptide-1 (GLP-1), (c) total gastric inhibitory polypeptide (GIP), and (e) total GLP-2 levels were measured after GFO and glucose loading. Glucose loading and GFO loading groups are represented by white circles with dotted line and black circles with solid line. *P < 0.05, **P < 0.01 versus glucose group. GLP-1, GIP, and GLP-2 secretion were evaluated by (b) AUC-GLP-1, (d) AUC-GIP and (f) AUC-GLP-2, respectively. Glucose loading and GFO loading groups are represented by white and black squares, respectively. **P < 0.01
