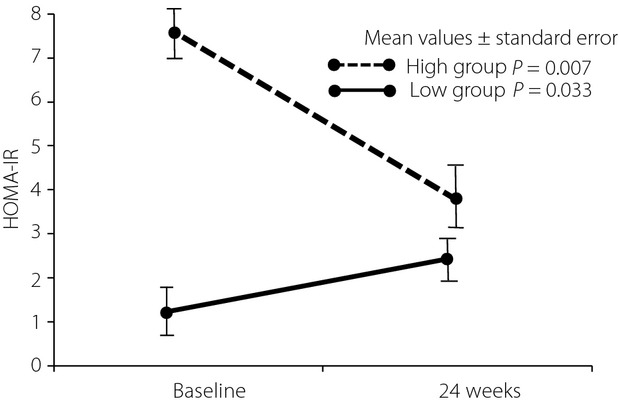
Figure 2.

Differential improvement of homeostasis model assessment of insulin resistance (HOMA-IR) between high- and low-HOMA-IR groups. When the patients are divided into high- and low-HOMA-IR groups by using the median of HOMA-IR, the high group (n = 30) shows a dramatically significant decrease of HOMA-IR, whereas the low group (n = 31) shows a more modest, but still significant, increase of HOMA-IR.
