
Figure 3.
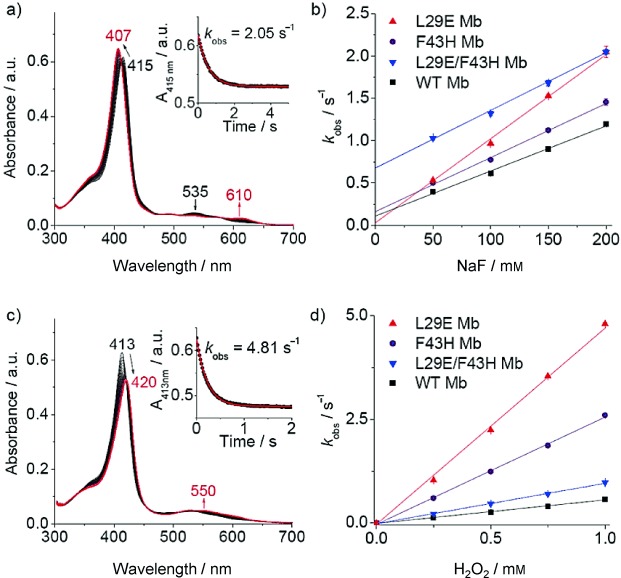
a) Stopped-flow spectra upon mixing L29E/F43H Mb and fluoride (5 μm and 100 mm, respectively, final concentration) in 100 mm KH2PO4 buffer (pH 7.0) for 5 s. b) Plots of observed rate constants versus fluoride concentrations. c) Stopped-flow spectra upon mixing L29E Mb and H2O2 (5 μm and 1 mm, respectively, final concentration) in the same buffer for 2 s. d) Plots of observed rate constants versus H2O2 concentrations. Insets in (a) and (c) show the single-exponential fit of the decay of the Soret band signal. For (b) and (d), data represent the mean ± SD for n=3 replicates.