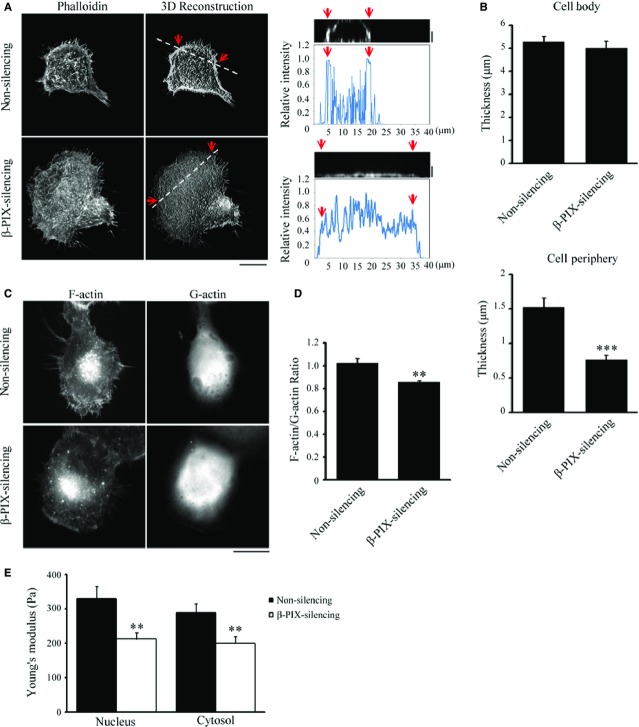
Figure 4.
β-PIX promotes actin polymerization and regulates actin cytoskeletal architecture. (A, left) Confocal images of non-silencing and β-PIX-silencing H1299 cells stained with fluorescent phalloidin to visualize F-actin. (Middle) 3D reconstruction taken from the z-series of confocal images of non-silencing and β-PIX-silencing H1299 cells stained with fluorescent phalloidin at every 0.2 μm depth from top to bottom; bar 15 μm. (Right) The side view image and relative intensity taken along the line highlighted in the 3D reconstruction image with the edge marked with red arrows and distance; bar 2 μm. (B) Quantification of the thickness of cell body and cell periphery of the non-silencing and β-PIX-silencing H1299 cells from the z-series images, as shown in (A). Data are mean ± SEM (n = 10 cells for each condition). ***P < 0.001, in comparison with non-silencing cells. (C) Epi-fluorescence images of non-silencing and β-PIX-silencing H1299 using staining with fluorescent phalloidin, to localize F-actin, and staining for DNase-I, to localize G-actin; bar 15 μm. (D) Ratio of the integrated intensity of F-actin normalized against G-actin. Data are mean ± SEM (n = 14 non-silencing cells; 10 β-PIX-silencing cells). **P < 0.01, in comparison with non-silencing cells. (E) Stiffness (Young's modulus; Pa) of non-silencing (n = 18 cells) and β-PIX-silencing (n = 25 cells) H1299 cells measured on the top of the nucleus and the cytosol, as described in Materials and methods. Data are mean ± SEM. **P < 0.01, as compared with non-silencing cells.

