Figure 7.
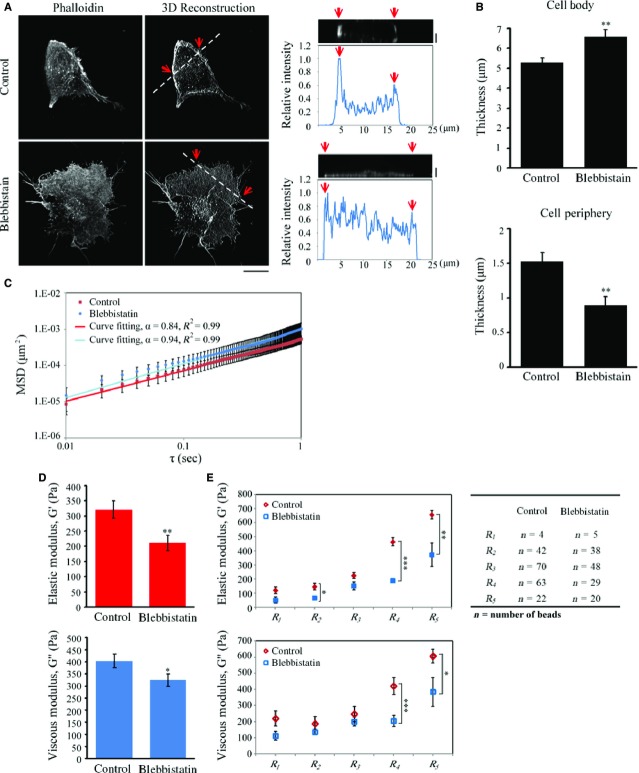
Inhibition of myosin II ATPase activity suppresses the organization of actin architecture and intracellular viscoelasticity at the cell periphery. (A, left) Confocal images of H1299 cells treated with control (DMSO) or blebbistatin (50 μM, 2 hrs) stained with fluorescent phalloidin to visualize F-actin. (Middle) 3D reconstruction taken from the z-series every 0.2 μm depth from top to bottom using confocal images of H1299 cells treated with control (DMSO) or blebbistatin (50 μM, 2 hrs) stained with fluorescent phalloidin; bar 15 μm. (Right) The side view image and relative fluorescent intensity as a function of position along the line highlighted in the 3D reconstruction image with the edges marked with red arrows; bar 2 μm. (B) Quantification of the thickness of cell body and cell periphery of H1299 cells treated with control (DMSO) or blebbistatin (50 μM, 2 hrs) from z-series images, as shown in (A). Data are mean ± SEM (n = 10 cells for each condition). **P < 0.01. (C) The mean squared displacement (MSD) as a function of the time lag (τ) of imbedded fluorescent particles in H1299 cells treated with control (DMSO) or blebbistatin (50 μM, 2 hrs). The MSDs were fit to the power law <Δr2(τ)> = Aτα. Data are mean ± SEM (control, n = 201 beads/35 cells; blebbistatin, n = 140 beads/24 cells). (D) Elastic moduli and viscous moduli of H1299 cells treated with control (DMSO) or blebbistatin (50 μM, 2 hrs). Data are mean ± SEM (control, n = 201 beads/35 cells; blebbistatin, n = 140 beads/24 cells). **P < 0.01. (E) Comparison of the local elastic moduli and viscous moduli in five regions (R1, R2, R3, R4 and R5, as prescribed in Fig.6A) and deduced from the analysis of the Brownian motion of the beads in those regions. Data are mean ± SEM (n in each conditions is indicated in the table). *P < 0.05, **P < 0.01, ***P < 0.001, in comparison with non-silencing cells.

