
Figure 1.
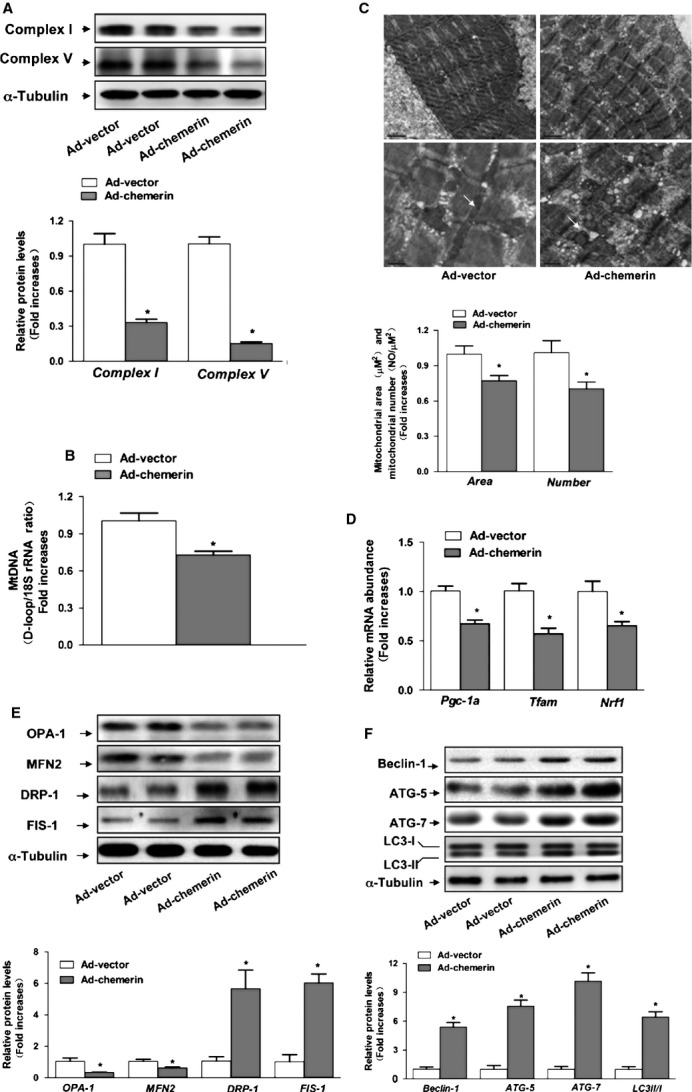
Effect of chemerin on the mitochondrial dynamics in skeletal muscle. (A) Expression of mitochondrial complexes I and V. (B) The mtDNA contents were determined by real-time PCR. (C) Morphometric analyses of the surface area of the mitochondria and mitochondrial density were performed. (D) mRNA expression of Pgc-1a, Nrf1 and Tfam. (E) Western blot images and quantitative analyses of OPA1, MFN2, DRP1and FIS-1. Upper: representative western blot image; bottom: quantitative analyses of the bands determined by densitometry. (F) Western blots images and quantitative analyses of ATG5, ATG7, Beclin-1 and LC3B. The results are expressed as fold increases over the control. The data are presented as the means ± SEM (n = 12). *P < 0.05 versus the control group.