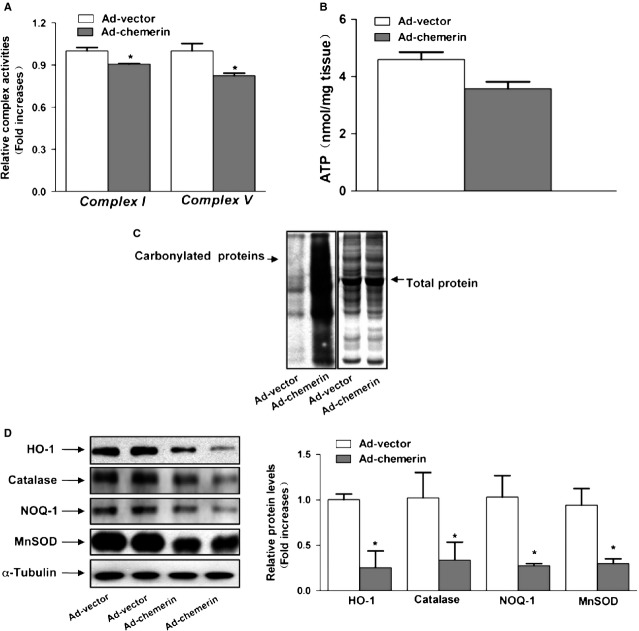
Figure 2.
Mitochondrial dysfunction in the skeletal muscle of chemerin-expressing mice. (A) The activities of mitochondrial complexes I and V were assayed by a spectrometric assay. (B) ATP content in the soleus muscle. (C) The skeletal muscle protein carbonyls were detected by western blotting. Other polyacrylamide resolving gels loaded with the same quantity of the samples and stained with Coomassie Brilliant Blue R250 served as the loading control. (D) Western blots images and quantitative analyses of HO-1, catalase, NQO-1 and MnSOD. Left: representative western blot image; right: quantitative analyses of the bands determined by densitometry. The results are expressed as fold increases over the control. The values are presented as the means ± SEM. *P < 0.05 versus the control group.

