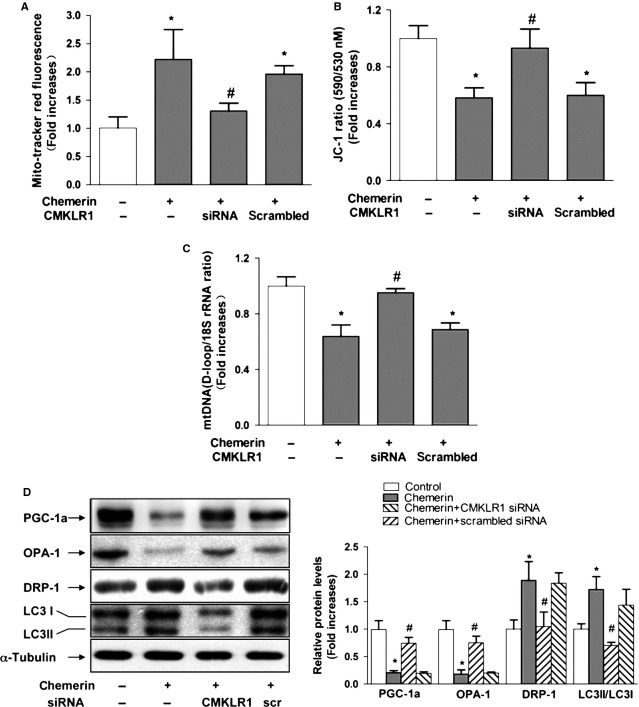
Figure 3.
Reduction of CMKLR1 reduces chemerin-induced mitochondrial loss, mitochondrial oxidative capacity and autophagy in C2C12 myotubes. Forty-eight hours after transfection with siRNA, the cells were treated with chemerin for 4 24 hrs. (A) Quantification of the ROS levels of C2C12 myotubes. (B) The membrane potential of C2C12 myotubes with different treatments was quantified. (C) The mitochondrial DNA contents were determined by real-time PCR. (D) Left: representative western blot image; right: quantification of the protein expression levels of PGC-1α, OPA-1, DRP-1 and LC3B. The results are presented relative to the values in the control cells. The data are presented as the means ± SEM from four independent experiments. *P < 0.05 versus the control group; #P < 0.05 versus the chemerin group.

