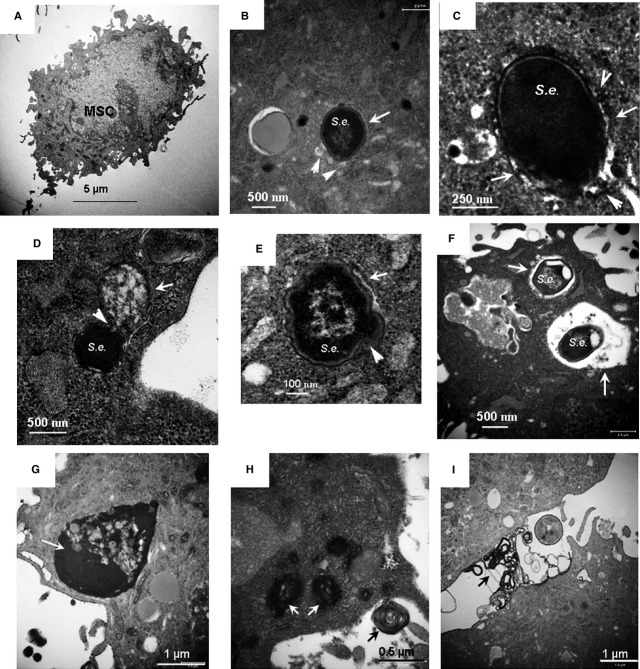
Figure 1.
Transmission electron microscopy (TEM) analysis of phagocytosis and autophagy/autolysosomal processing of Staphylococcus epidermidis in BMSCs. (A) A micrograph of a control BMSC. (B and C) Micrographs of autophagosomal sequestration of S. epidermidis in BMSCs taken with different magnifications; BMSCs were fixed 5 hrs after the challenge. Autophagosome membranes are indicated with white arrows; fusion of small lysosomes with autophagosome encapsulating a microorganism is shown with white arrowheads. (D) Micrograph of fusion of autophagosome encapsulating a microorganism (white arrowheads) with a large autolysosome (white arrows); BMSCs were fixed 5 hrs after challenge. (E and F) Micrographs of degradation of sequestered S. epidermidis in large autolysosomes; BMSCs were fixed 24 hrs after challenge. (G–I) Formation of high-electron density secretory vacuoles in the challenged cells is indicated with white arrows; extracellular release of the secretory factors is indicated with black arrows. BMSCs were fixed 5 hrs after the challenge. Conditions: BMSCs were challenged with approximately 5 × 10⁷ bacteria/ml for 3 hrs. The cells were harvested and fixed for TEM 5 and 24 hrs after challenge.

