
Figure 7.
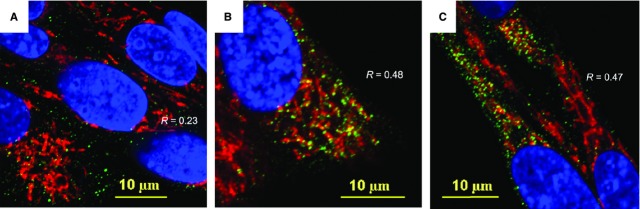
Immunofluorescence confocal image analysis of mitochondrial translocation of Drp1 fission protein in BMSCs challenged with Staphylococcus epidermidis. (A) Control BMSCs. The mitochondrial network was visualized using projections of Tom20 (red channel), a mitochondrial marker. Projections of Drp1 protein appear in green. Projections of the nuclear DNA appear in blue (counterstaining of nuclei with Hoechst 33342). Index of spatial correlation of Tom20 and Drp1 is defined as R = 0.23 (see Materials and methods). (B) Alterations in mitochondrial translocation of Drp1 (green channel) observed 5 hrs after bacterial challenge. The mitochondrial network is displayed as projections of Tom20 (red channel). Index of spatial correlation of Tom20 and Drp1 is defined as R = 0.48 (see Materials and methods). (C) Alterations in mitochondrial translocation of Drp1 (green channel) observed 24 hrs after bacterial challenge. The mitochondrial network appears as long-length thread-like projections of Tom20 (red channel). Index of spatial correlation of Tom20 and Drp1 is defined as R = 0.47. The presence of interaction between Drp1 and Tom20 appears in yellow as result of interference of red and green colours. The confocal images were taken with pinhole setup to obtain 0.3 μm Z-sections. The images shown in the figure are representative ones of analyses of three specimens obtained from three experiments.