
Figure 8.
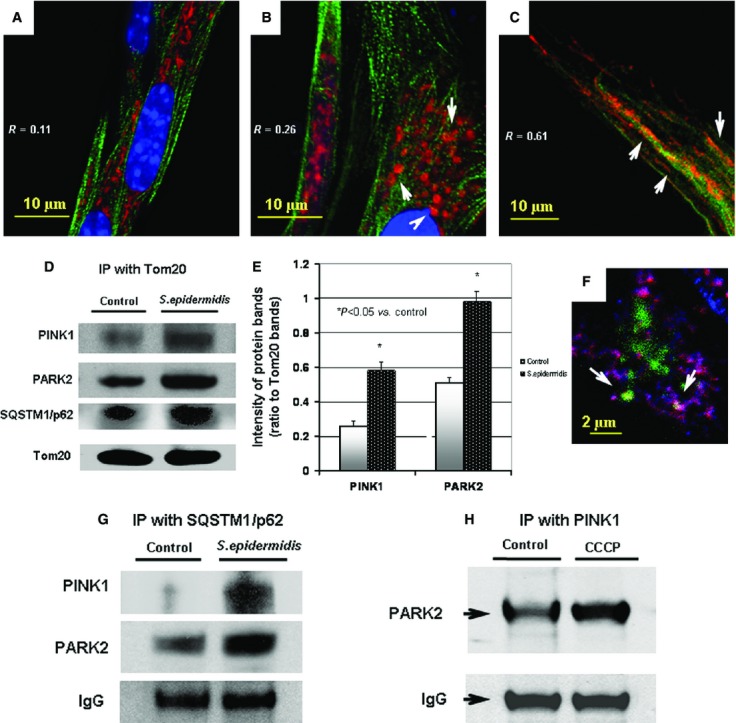
Immunofluorescence confocal image analysis of mitochondrial translocation of PARK2 protein in BMSCs challenged with Staphylococcus epidermidis. The mitochondrial network was visualized with projections of Tom20 (red channel), a mitochondrial marker. Projections of PARK2 protein appear in green in A, B, C and in blue in F. Projection of the nuclear DNA appears in blue (counterstaining of nuclei with Hoechst 33342) in A, B, C. Spatial co-localization of Tom20 and PARK2 appears in yellow in A, B, C as result of interference of red and green colours. Spatial co-localization of Tom20 and PARK2 appears in pink colour in F as result of interference of red and blue colours. (A) Control BMSCs. Index of spatial correlation of Tom20 and PARK2 was determined as R = 0.11 (see Materials and methods). (B) Alterations in mitochondrial translocation of PARK2 (green channel) observed 5 hrs after bacterial challenge. The mitochondrial network appears as numerous round-shape projections of Tom20 (red channel). Index of spatial correlation of Tom20 and PARK2 determined as R = 0.26 (see Materials and methods). (C) Alterations in mitochondrial translocation of PARK2 (green channel) observed 24 hrs after bacterial challenge. The mitochondrial network appears as long-length thread-like projections of Tom20 (red channel). Index of spatial correlation of Tom20 and PARK2 was determined as R = 0.61. The confocal images were taken with pinhole setup to obtain 0.3 μm Z-sections. The images shown in the figure are representative ones of analyses of three specimens obtained from three experiments. (D) Immunoblotting analysis of Pink1, PARK2 and proteins co-immunoprecipitated with Tom20 protein. Immunoprecipitation (IP) assessment of the protein interaction on the BMSC mitochondria 24 hrs after bacterial challenge. (E) Densitometrical analysis of the protein bands shown in D; the displayed data are ratio of the protein band densities to the densities of the respective Tom20 bands. (F) Immunofluorescence assessment of spatial interaction of PARK2 (blue channel) and LC3 (green channel) with mitochondrial Tom20 (red channel) in BMSC subjected the bacterial challenge (24 hrs). Co-localization of Tom20 with PARK2 and LC3 appears in form of white circles, i.e. mitophagosomes (indicated with white arrows) as result of interference of blue, green and red colours. (G) Immunoblotting analysis of PINK1 and PARK2 proteins co-immunoprecipitated with SQSTM1/p62 protein. IP assessment of the protein interaction on the BMSC mitochondria 24 hrs after bacterial challenge. (H) Immunoblotting analysis of PARK2 protein co-immunoprecipitated with mitochondrial Pink1protein. IP-assessment of increase in interaction of Pink1 with PARK2 in the BMSC mitochondria after mitochondrial depolarization by treatment with 10 μM CCCP, a mitochondrial uncoupler, for 6 hrs.