
FIG. 4.
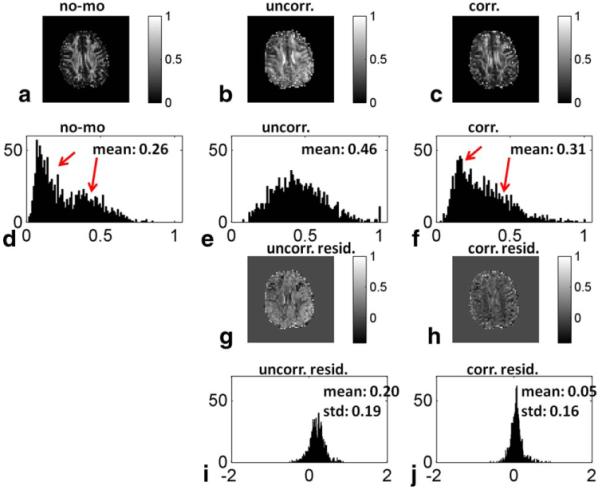
Representative FA maps from a single slice for a baseline (a), uncorrected (b), and corrected (c) scan, their corresponding histograms (d, e, and f), the residuals of uncorrected and corrected maps after subtracting the baseline map (g, h), and their corresponding histograms (i and j). [Color figure can be viewed in the online issue, which is available at wileyonlinelibrary.com.]