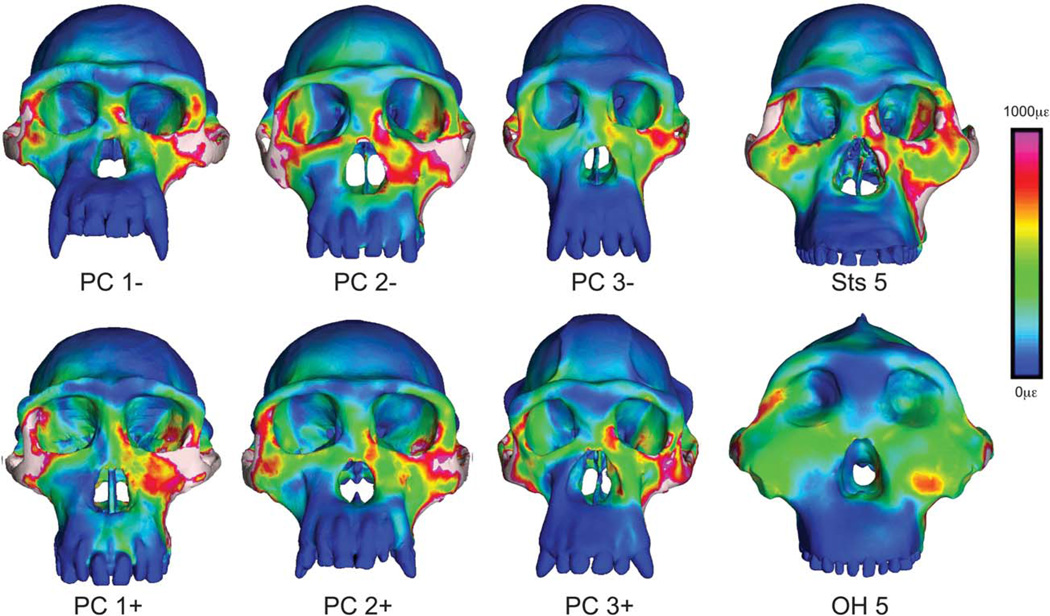
Fig. 7.
Visualization of strain during molar biting. Color mapping of von Mises strain in FEMs of the crania of P. troglodytes, A. africanus, and P. boisei during simulated bites on the left second molar. Crania are scaled to the same height to visually accentuate differences in shape. White regions indicate areas where strains exceed 1,000 microstrain.

