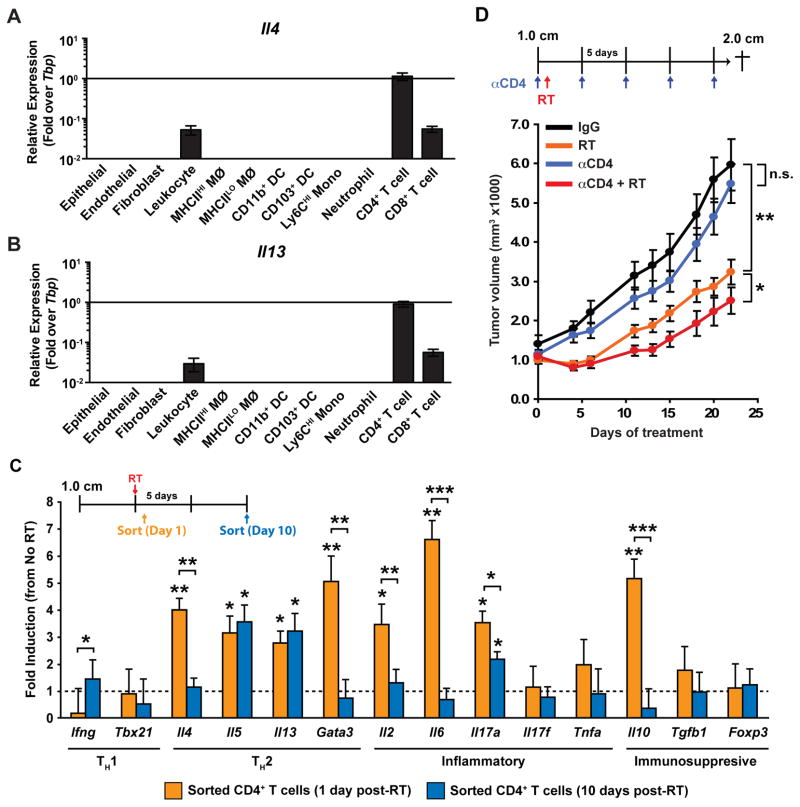
Figure 3. Th2-polarized CD4+ T cells promote tumor regrowth after radiation therapy.
A–B) mRNA levels of Il4 (B) and Il13 (C) in FACS-sorted populations of epithelial and stromal populations from untreated MMTV-PyMT mammary tumors, as determined by real-time PCR. Data are normalized to Tbp expression and displayed as mean ± SEM with n=8 per cell type. MØ, macrophage; mono, monocyte; DC, dendritic cell. C) CD45+CD3+CD4+ T cells were FACS sorted from orthotopic PyMT-derived explant tumors at Days 1 and 10 following treatment with RT (5 Gy). mRNA expression from sorted cells was then analyzed using quantitative real-time PCR for the indicated genes. Treatment schematic is depicted at the top and data are expressed as mean fold-change ± SD compared to untreated tumors (4 mice/group). Statistical significance was determined by an unpaired t-test relative to untreated controls, or between Day 1 and Day 10 as indicated. D) Orthotopic PyMT-derived explant tumors were grown to a median diameter of 1.0 cm and then the tumor-bearing mice were enrolled in the study. On Day 1 mice were then subjected to localized gamma irradiation (5 Gy) and total tumor burden/animal assessed every 3 days until endpoint. αCD4-depleting antibody was administered 2 days prior to RT and then every 5 days for the duration of the study. Treatment schematic is depicted at top and data are displayed as mean tumor burden ± SEM (>8 mice/group). Statistical significance was determined by two-way ANOVA. One of two experiments is shown. For all figures statistical significance is shown as *p < 0.05, **p < 0.01, ***p < 0.001.

