
Figure 1. Trajectory of cognitive decline from a model without mixture (K=1).
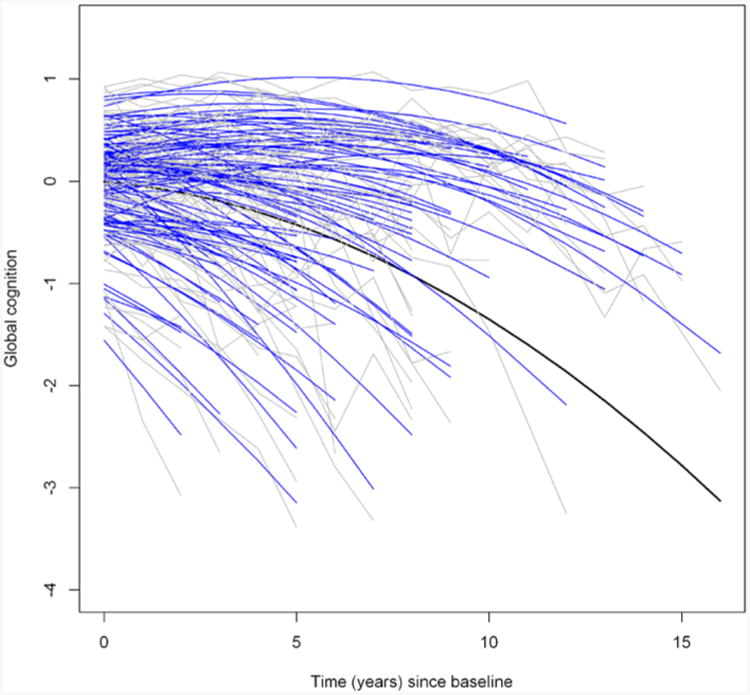
The figure shows the raw cognitive data (gray) and fitted values (blue) from a linear mixed model (k=1) for a random sample of 100 participants. The black curve corresponds to the fitted mean trajectory.