
Figure 3. Distinct profiles of cognitive decline by latent groups.
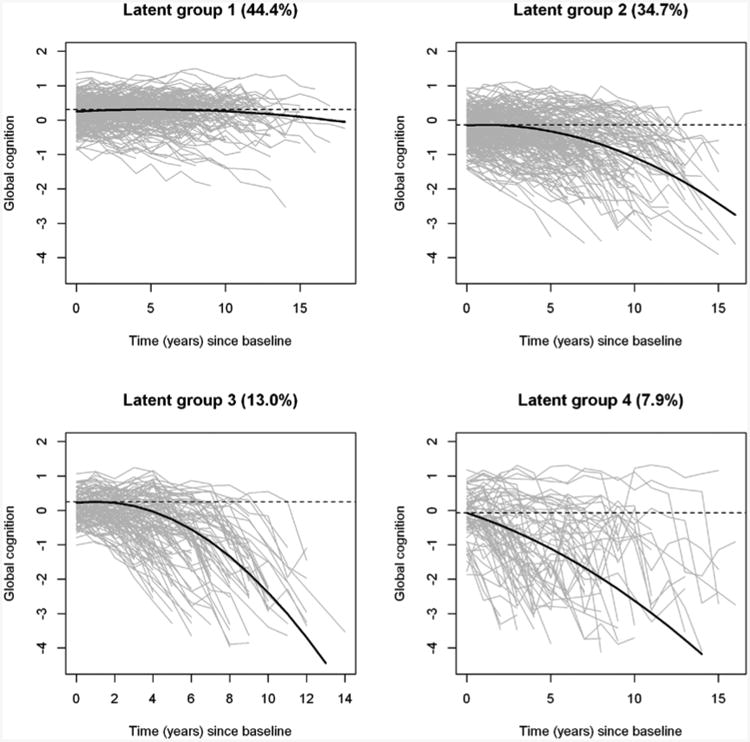
The figure shows the observed longitudinal global cognitive trajectories (gray) for the participants, as well as model derived mean trajectories (black), by latent groups.
Official websites use .gov
A
.gov website belongs to an official
government organization in the United States.
Secure .gov websites use HTTPS
A lock (
) or https:// means you've safely
connected to the .gov website. Share sensitive
information only on official, secure websites.
The figure shows the observed longitudinal global cognitive trajectories (gray) for the participants, as well as model derived mean trajectories (black), by latent groups.