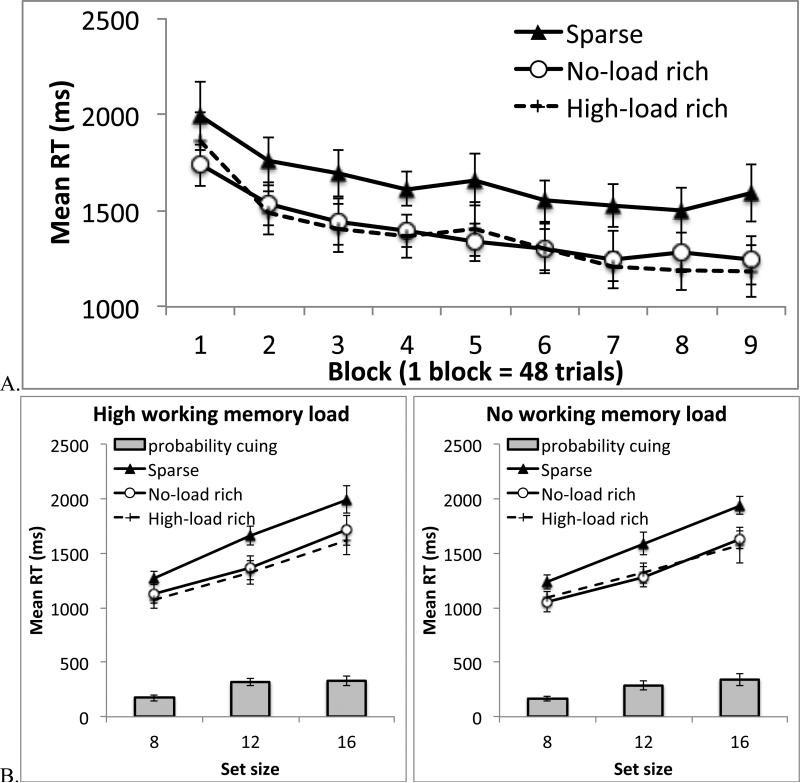
Figure 6.
Results from Experiment 3. A. Search RT across 9 blocks of trials. B. Search RT in Blocks 2-9, separately for different working memory conditions and different set sizes. The gray bars show the difference between the rich conditions (the mean of high-load rich and low-load rich) and the sparse condition. Error bars show 95% confidence interval based on the within-subject S.E.M.

