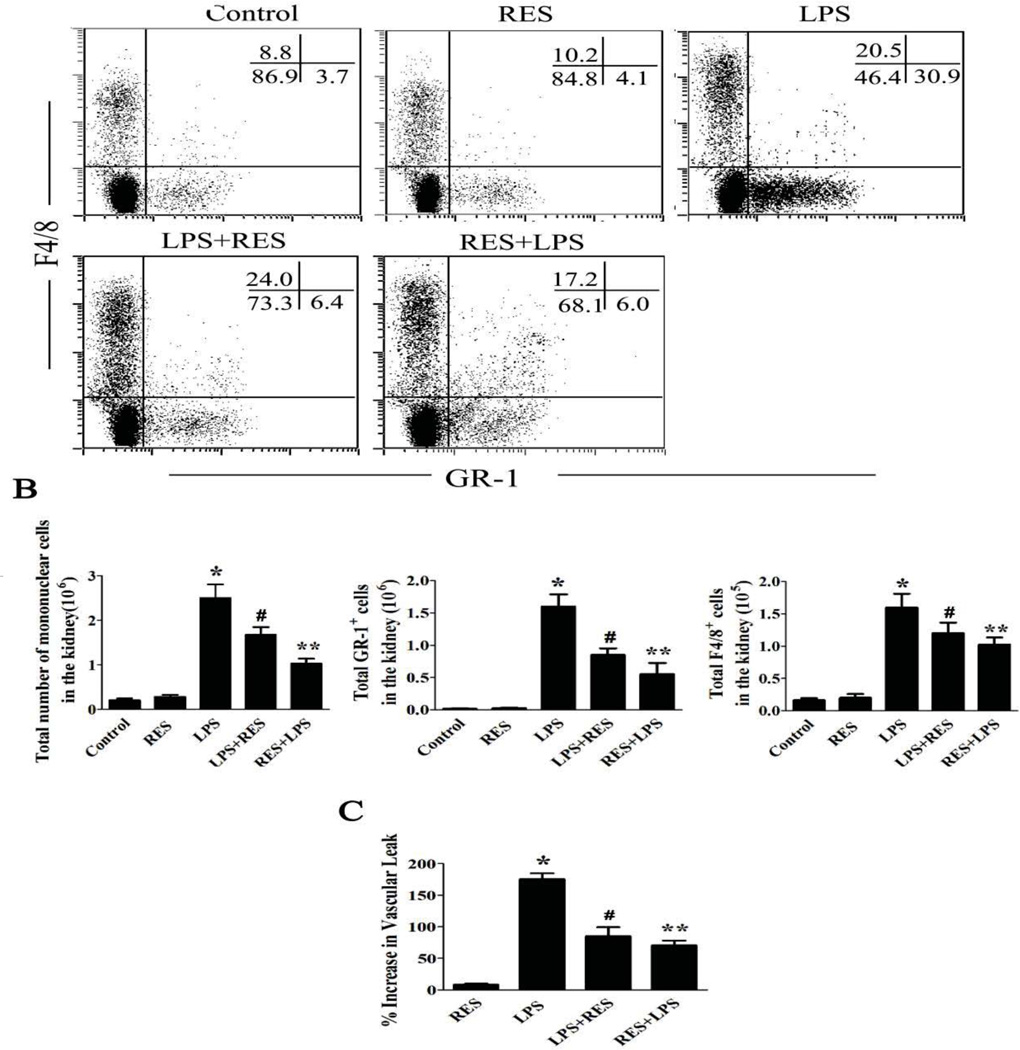
Figure 3. Resveratrol reduces infiltrating inflammatory cells and decreases renal endothelial permeability.
LPS, control buffer, and resveratrol were administered as described above. A. Representative dot-plots for phenotyping inflammatory cells in the kidneys. Mice were treated as above; renal infiltrative immune cells were isolated. Cells were stained with granulocyte (GR-1) and macrophage (F4/8) markers. B. The number of total cells, granulocytes and macrophages isolated from the kidney in each mouse are shown in the diagram, respectively. C. Renal vascular permeability was measured with Evans blue dye. The increased vascular permeability was shown in the bar diagram and compared to a control group. The groups were designated as follows, LPS: LPS injected group; RES: Resveratrol only group; RES + LPS: LPS + Resveratrol pre-treatment group; LPS + RES: LPS + Resveratrol post-treatment group. Data were presented as mean ± SEM. (n=8, *p<0.01 vs. Control, **p<0.01 vs. LPS, #p<0.05 vs. LPS).

