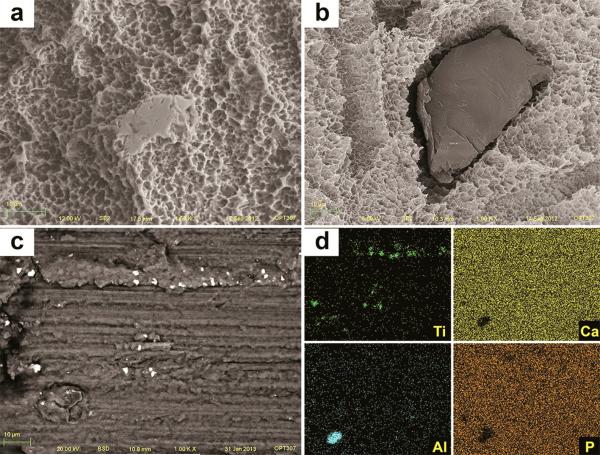
Figure 12.
SEM image of SL implant after insertion into bone revealed sharp peaks less prominent or completely removed, resulting in flattened smooth areas after implant insertion (a). Also, the alumina grit-particles (dark and smooth) embedded into the surface (b) were less prevalent after insertion. Along the implantation sites, particles were identified by SEM-BSD (c) and their Ti and Al content was shown by EDS mapping of the surface (d).

