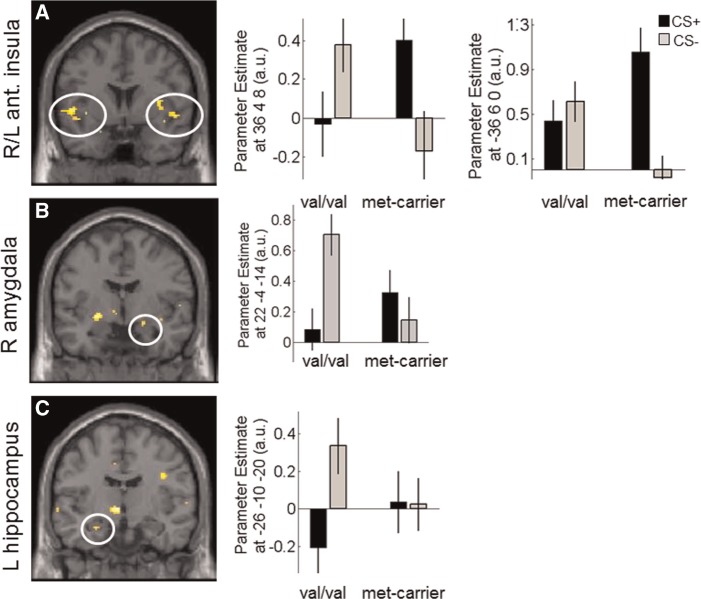
Fig. 3.
Activation in the contrast CS+> CS− for met-carriers > val/val in the bilaterial anterior insula (A) right amygdala (B) and left hippocampus (C). Images are thresholded at P < 0.001(UC) for illustrative purposes. Error bars represent s.e.m. and beta estimates are derived from peak coordinates.

