
Fig. 2.
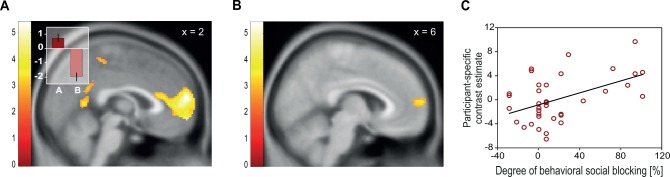
Activity in mPFC reflects expectation and blocking of social rewards. (A) mPFC responses were higher to reward-predicting A stimuli as compared with neutral B stimuli (2, 60, 16; P < 0.05, FWE-corrected). Contrast estimates (inset) show mPFC responses to A and B stimuli separately. Error bars indicate SEM. (B and C) Differences in activation responses to Y as compared with X increased in the mPFC (6, 60, 12, P < 0.05, FWE small-volume corrected) with degree of blocking in the social condition. Blocking was quantified as the difference in reward-expecting responses to non-blocked stimulus Y compared with blocked stimulus X. Color bars indicate z-scores.