
Figure 3.
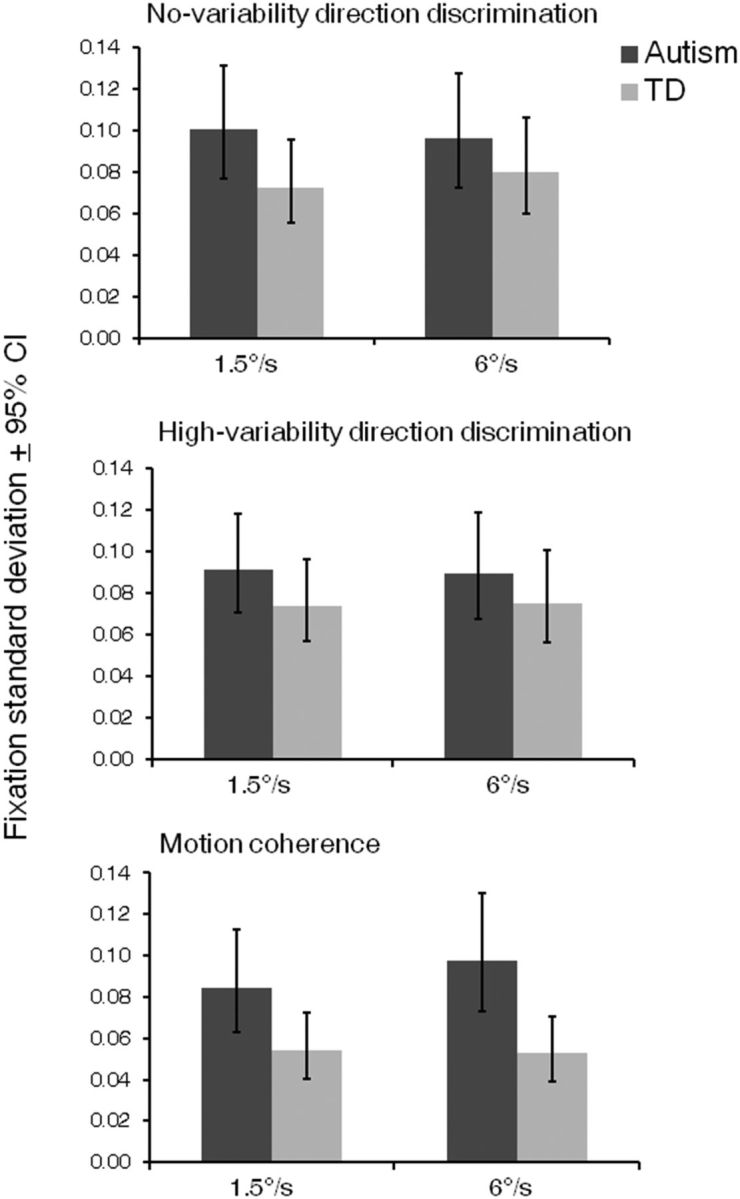
Fixation SDs. Fixation SDs during stimulus presentation in the no-variability (top) and high-variability (middle) conditions of the direction integration task and the motion coherence task (bottom), in which higher values reflect less stable fixations. There was a main effect of task (F(2,42) = 4.96, p = 0.01, ηp2 = 0.19), with significantly lower fixation SDs in the motion coherence task than in either condition of the direction integration task (ps ≤ 0.01). There was no overall difference in fixation SDs between the children with autism and typically developing (TD) children (F(1,43) = 3.68, p = 0.06), but there was a significant interaction between task and group (F(2,42) = 3.88, p = 0.03, ηp2 = 0.16). Post hoc analysis revealed that the groups differed only in the motion coherence task (F(1,43) = 7.82, p = 0.008, ηp2 = 0.15). The main effect of speed and all other interactions were not significant (ps ≥ 0.44).