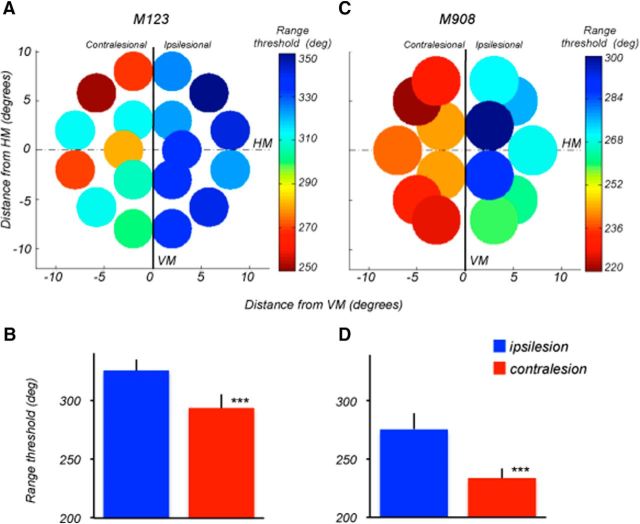
Figure 4.
Mapping of direction range thresholds. A, C, Range thresholds for M123 and M908 measured at multiple locations in the ipsilesional and contralesional visual fields. Delay between S1 and S2: 1.5 s. For M123, stimuli were 4° diameter, moving at 15°/s. For M908, stimuli were 5° diameter, moving at 10°/s. Threshold values are color-coded (blue-green, higher thresholds, yellow-red, lower thresholds). Note, the superiority of nearly all thresholds measured in ipsilateral hemifields of both monkeys. B, D, Average range thresholds for M123 (B) and M908 (D) computed by combining all values measured within the ipsilesional (blue column) and contralesional (red column) hemifields. In both animals, contralesional thresholds were significantly poorer (M123 and M908, p < 0.000001, two-tail t test). Error bars are SD. HM, Horizontal meridian; VM, vertical meridian.

