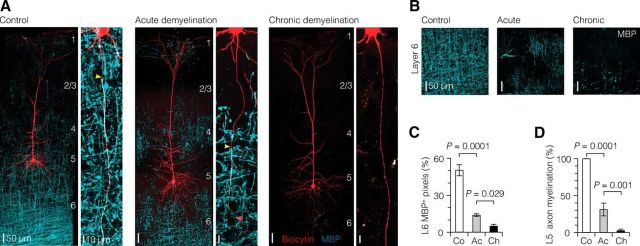
Figure 1.
Graded demyelination of L5 axons in the somatosensory cortex. A, Left, z-projected overview images of the morphology of thick-tufted L5 neurons in the somatosensory cortex (biocytin fill, red) overlaid with immunofluorescence staining for MBP (cyan). Right, Higher-magnification z-projected images show the progressive demyelination of primary L5 axons. Yellow arrowheads indicate the onset of myelin. B, Confocal images of L6 region immunolabeled for MBP expression showing the progressive loss of myelin with increasing cuprizone dosage and treatment duration. C, Quantification of MBP immunofluorescence in L6 region. Control, n = 10; acute, n = 18; chronic, n = 10. D, Bar plot of the extent of myelination of single L5 axons. Control, n = 10; acute, n = 14; chronic, n = 16. One-way ANOVA followed by Bonferroni's post hoc test. Co, Control; Ac, acute; Ch, chronic. Data are presented as mean ± SEM..

