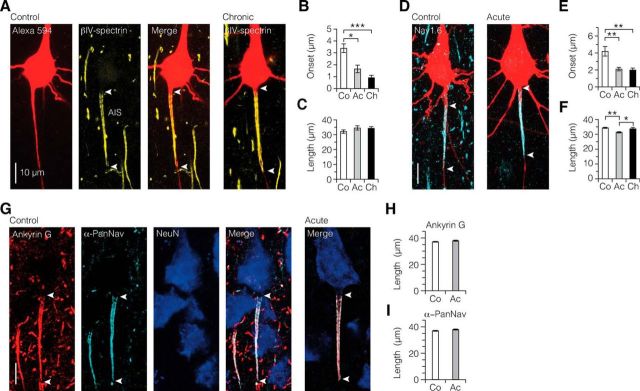
Figure 3.
Demyelination-induced ion channel reorganization in the AIS. A, Single fluorescence channels and merged image of z-projected confocal scans of the soma and AIS morphology (Alexa Fluor 594 fill, red) and immunofluorescence labeling of βIV-spectrin (yellow). White arrowheads indicate the onset and extent of βIV-spectrin immunofluorescence identifying the AIS. B, C, Bar plots showing more proximal onset, but maintained length of expression of the AIS βIV-spectrin immunofluorescence. Kruskal–Wallis followed by Dunn post hoc test. Onset: *p = 0.042, ***p = 0.0003. Control, n = 8; acute, n = 13; chronic, n = 16. D–F, Nav1.6 immunofluorescence labeling (cyan) is significantly more proximal in its onset and changed in length in demyelinated axons. Onset: control versus acute, **p = 0.0025; control versus chronic, **p = 0.0043. Length: control versus acute, **p = 0.0023; acute versus chronic, *p = 0.039. Control, n = 14; acute, n = 23; chronic, n = 17. G–I, Confocal images of triple immunofluorescence of ankyrin G, α-PanNav, and NeuN. For both ankyrin G and α-PanNav expression, length was maintained in acute demyelination. Mann–Whitney test. Ankyrin G, p = 0.1647; α-PanNav, p = 0.099. Control, n = 44 AISs; acute, n = 63 AISs.

