
Figure 5.
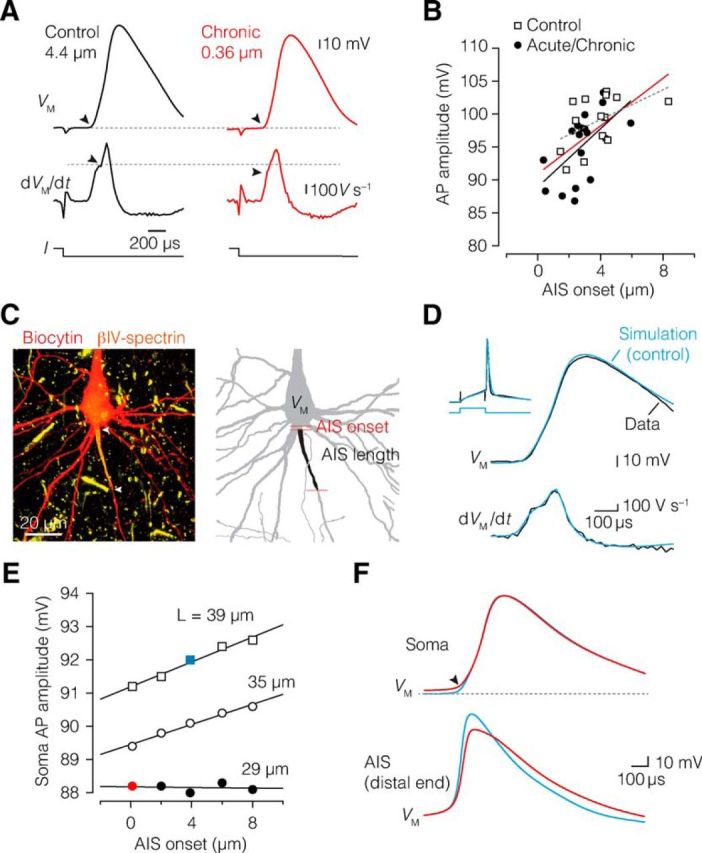
AIS relocation and length reduction impairs AP initiation. A, Neurons with proximal AIS onset generate APs with significantly lower amplitude. Top, Single AP from a control (black) and chronically demyelinated neuron (red) after a current injection (bottom), showing reduced AP amplitude in chronic demyelinated neuron with a more proximal AIS onset. Middle, Differentiated voltage, dVM/dt, of the same traces, with a decreased initial peak (black arrowheads) reflecting a reduced current flow from the AIS during the onset of somatic voltage waveform. Control (black): onset, 4.4 μm; AP amplitude, 103.1 mV; dVM/dt, 390.5 V s−1. Chronic (red): onset, 0.36 μm; AP amplitude, 93.0 mV; dVM/dt, 358.8 V s−1. B, AIS onset significantly correlated with AP amplitude in control (dotted gray line, closed circles; Spearman's ρ = 0.589, p = 0.021, n = 15) and demyelinated neurons (black line, open squares; Spearman's ρ = 0.623, p = 0.004, n = 19). The combined data were fit with a linear function y = 1.8x + 90.9 (red line). Spearman's rank correlation (ρ). C, Left, Confocal projection of the morphology of a thick-tufted L5 neuron labeled for biocytin and βIV-spectrin. Right, 3D reconstruction of the same cell used for computational modeling. D, Overlaid and aligned AP voltage waveforms from the experimental data (black) and simulated neuron (blue) for voltage (top) and time derivative (bottom). The inset shows the 6 ms, ∼1 nA current step, and voltage responses. Note the high degree of similarity between experiment and simulation. E, Adjusting the AIS onset distance (x-axis) and length of the AIS in the model (open and closed circles and open squares) revealed that the length of the AIS had more impact on the somatic AP amplitude compared with AIS onset changes. F, Examples of overlaid and aligned voltage traces of the simulated somatic AP waveform (top) and the AIS (bottom) corresponding to control parameters (blue) and reduced AIS onset and length values as shown in E. Note the broader local AIS AP.