Fig. 2.
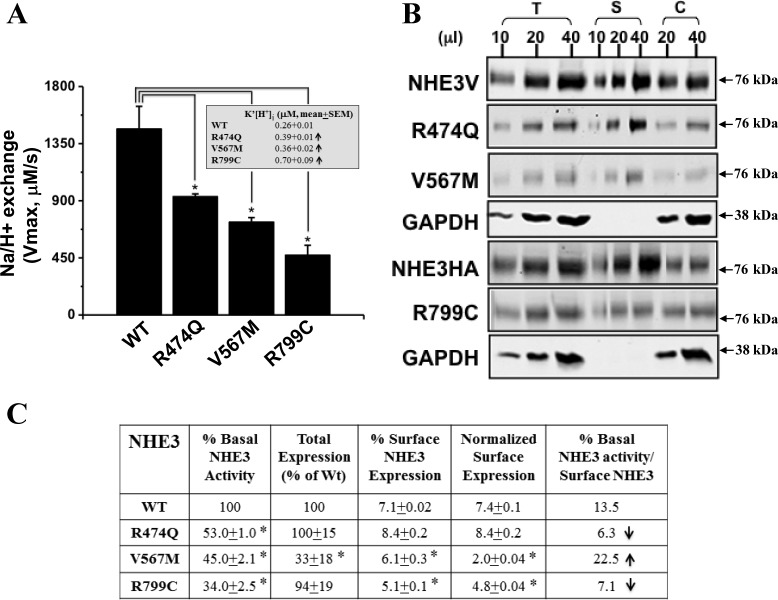
The 3 NHE3 variants have decreased basal Na+/H+ exchange activity. A: Na+/H+ transporter activity was measured in PS120/NHERF2 cells transfected with wild-type (WT) NHE3 or its mutants R474Q, V567M, and R799C. Data are presented as means ± SE from at least 3 independent experiments. *P < 0.05, comparison between wild-type NHE3 and the individual mutants (Student's t-test). Inset: K'(H+)i obtained by kinetic analysis of the same experiments used for the NHE3 transport activity (Vmax) calculations. K'(H+)i, ↑P < 0.05. B: surface expression of NHE3 [either epitope tagged with VSVG (NHE3V) or HA (NHE3HA)] and its polymorphic variants R474Q, V567M, and R799C was determined by cell surface biotinylation assay. NHE3 proteins in total lysates (T), surface fractions (S), and intracellular fractions (C) are labeled. A representative experiment, repeated 4 times is shown. Molecular mass standards are shown at right. GAPDH is only shown for WT. C: table shows results are means of 3–4 experiments ± SE. Column 1: relative Na+/H+ transporter activity in the variants after normalizing to WT NHE3 in each experiment. Column 2: total expression of each polymorphism normalized to WT NHE3. Column 3: percentage of total NHE3 on the plasma membrane. Column 4: normalized surface NHE3 per cell, which was obtained as the product of the normalized surface NHE3 (column 2) times the percent surface expression of each construct (column 3). Rounding causes some variation. In columns 1-4, *P < 0.05. Column 5 is column 1/column 4; however, since experiments in columns 1 and 4 did not entirely overlap, statistical evaluation is not provided.

