
Fig. 8.
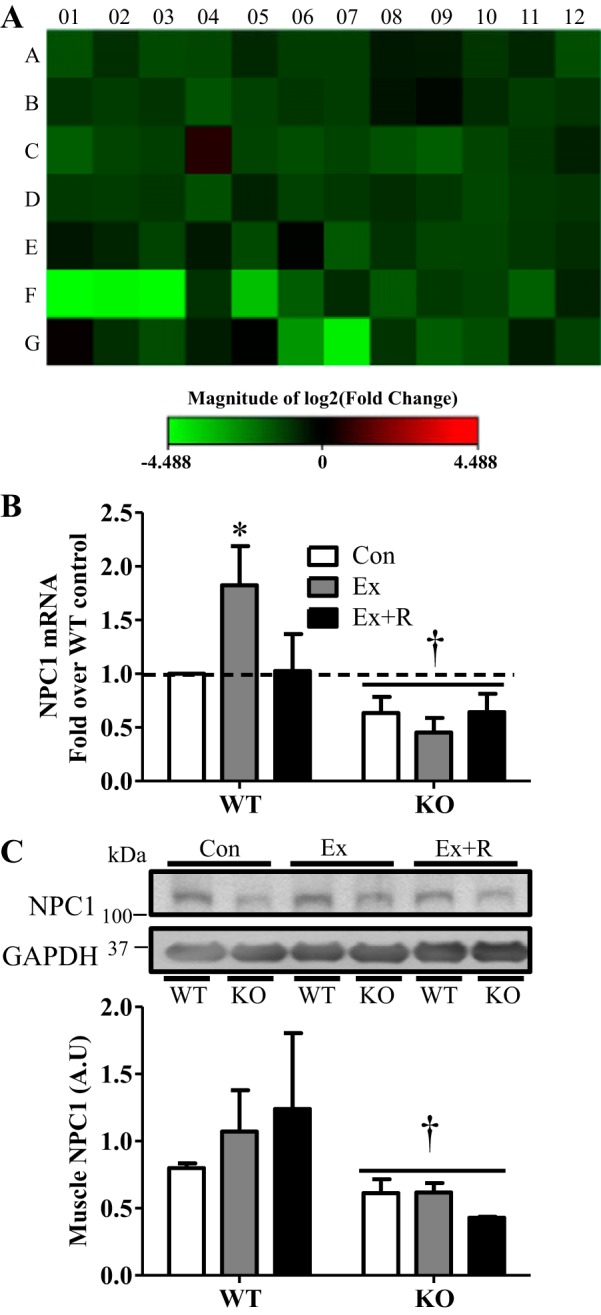
Identification of Niemann-Pick C1 (NPC1) as a PGC-1α-regulated autophagy factor through PCR-array analysis. A: heat map showing expression of 84 autophagy-related genes in WT and KO animals. Green indicates reduction, while red indicates increase, in gene expression; the brighter the color, the greater the change in gene expression. (For the full list of fold changes and statistical significance see Supplemental Table S1.) B: gene expression of NPC1 in WT and KO animals in Con, Ex, and Ex + R groups compared with WT animals in Con group. Gapdh and Actb were used as housekeeping genes. C: representative blot and quantification of NPC1 in tibialis anterior muscle extracts. GAPDH was used as loading control. Values are means ± SE; n = 3–4. *P < 0.05, significant effect of exercise. †P < 0.05, significant effect of genotype.