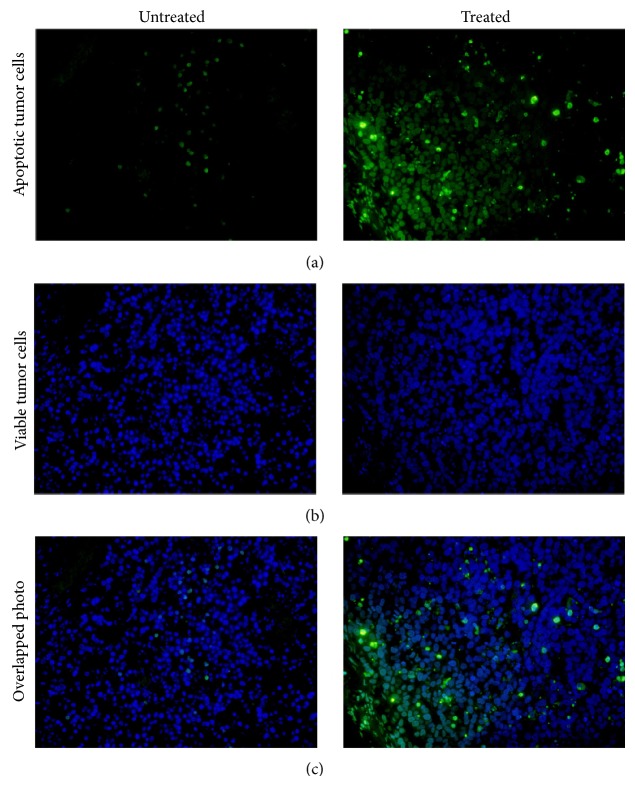
Figure 6.
TUNEL staining analysis of untreated (left) and CTX treated (right) SPCA-1 tumor tissues. Seen under the fluorescence microscope at a certain wavelength, viable tumor cells were stained in blue (b), while the apoptotic tumor cells were stained in green (a). The overlapped photograph (c) indicated more apoptotic tumor cells (green color) in the treated tumor samples than the untreated tumor tissues.

