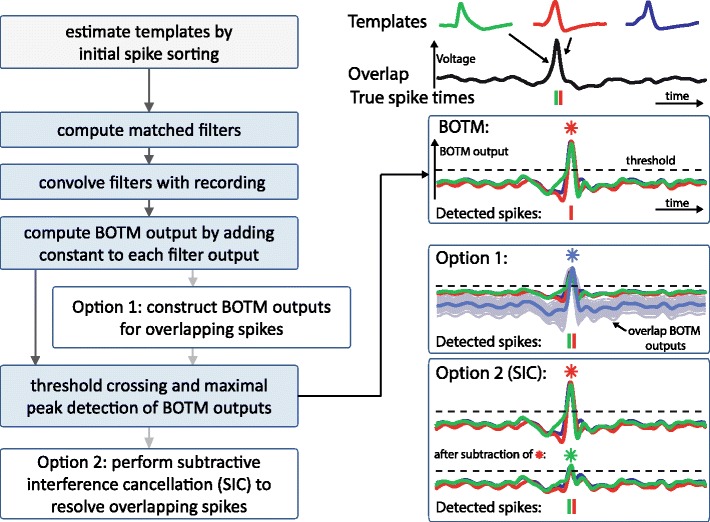
Fig. 2.

Flowchart of the BOTM method (left) and illustration of the most important steps (right) on an example overlapping spike from Benchmark 1 (Q) (top, right). BOTM outputs are computed for each template (box labeled “BOTM”) and thresholded to detect and classify spikes. To resolve overlapping spikes two alternative approaches are possible. Box labeled “Option 1”: from the individual template BOTM outputs more BOTM outputs are constructed that reflect the presence of overlapping spikes (light grey traces on the right, here shown only for overlaps of maximal 2 spikes and 3 samples temporal difference); the one with the highest peak is marked in dark grey). Box labeled “Option 2 (SIC)”: Once a spike is detected by threshold crossing on the BOTM outputs, it is subtracted from each BOTM output and the threshold is reapplied iteratively
