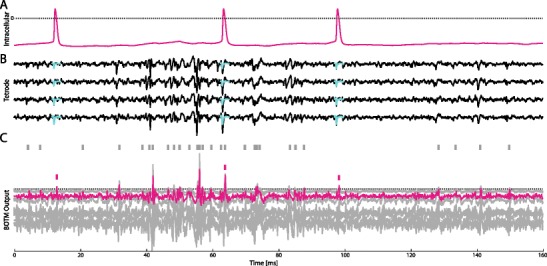
Fig. 4.

Illustration of the BOTM responses on a 160 ms piece of benchmark 2 (H). a Intracellular recording of a single neuron. b Extracellular recording using a tetrode located nearby the neuron recorded in a. At the time points at which a spike was detected in the intracellular recording the spike-triggered average (template) of the target neuron superimposes the recordings (cyan traces) for each electrode. c BOTM output and sorted spikes. In this recording, 10 putative neurons were found by the initial spike sorting, one of which was assigned to the target neuron (magenta). Each putative neuron has an associated BOTM output. For sake of clarity, neurons for which no ground truth was available are depicted in grey. Small ticks over the traces show the sorting output of the BOTM + SIC procedure. The three spikes of the target neuron were correctly detected and classified. The spike in the middle was classified as part of an overlapping spike. The dotted line represents the detection threshold
