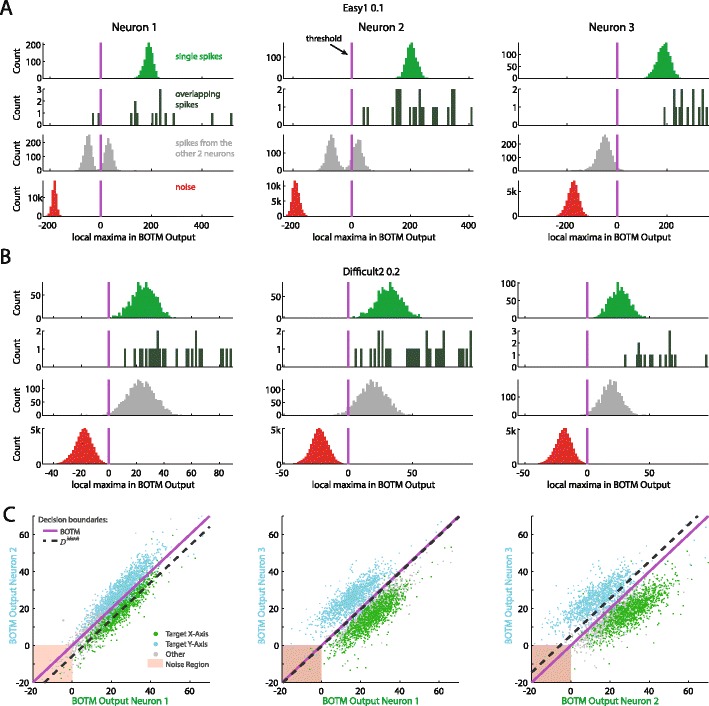
Fig. 5.

Distributions of local maxima (in a window of 15 samples) in BOTM filter outputs for single spikes, overlaps (within 15 samples), and noise for the three neurons in benchmark 1 (Q) Easy1 N.10 (a) and Difficult 2 N.20 (b–c). The optimal threshold thr for p(n) = 0.99 is shown as a vertical line (magenta). For each neuron, spikes from other neurons (second row from bottom, grey) can cause filter responses to cross the threshold. Thus, spike classification can only be done reliably by combining the information from all three BOTM outputs. a-b The majority of overlapping spikes (second row from top, dark green) causes the BOTM outputs of all participating neurons to cross threshold. Please note that with thr = ln(p(n)), for this example, the exact choice of p(n) does not strongly influence sensitivity: for a wide range of choices for p(n) the threshold will be close to zero which will separate the noise from the spike distribution. a For all three neurons the response to noise (bottom, red) is well separated from the response to the target spikes (top, green) by a large margin. Spike detection and classification of single spikes can be done without error (except for overlapping spikes) since the green, grey and red distributions do not overlap. b In the low SNR case the green and red distribution are close to each other and start overlapping. Note that the overlap between the “single spike” distribution and the “other spikes” distribution does not directly imply any classification errors, since the classification depends on the maximal response over all three neurons. c Projection of the spikes from b in the response space spanned by two of the three BOTM outputs (all three combinations are shown). In this space, the discrimination boundary given by a max-operation on the BOTM outputs is the identity line (magenta). Spikes are colored according to their ground truth identity: spikes that should elicit the strongest response for the BOTM output on the x-axis are shown in green; spikes that should elicit the strongest response for the BOTM output shown on the y-axis, and, therefore, should lie above the identity line, are shown in cyan. Spikes of the neuron for which the BOTM output is not shown are grey. If all BOTM outputs are below the threshold (0) they are not detected (‘noise region’). For comparison, the respective decision boundary of D Matchi is shown as a dashed line
