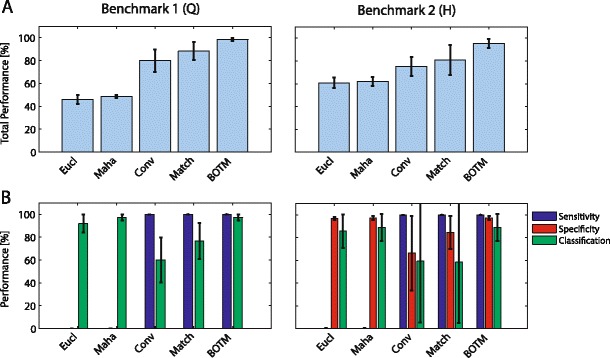
Fig. 6.

Performance evaluation benchmark 1 (Q) (left column) and benchmark 2 (H) (right column). Error bars indicate standard deviation among different data files of the same benchmark. a Total performance of different template matching procedures and b Performance for different error categories defined in section “Evaluation metrics”
