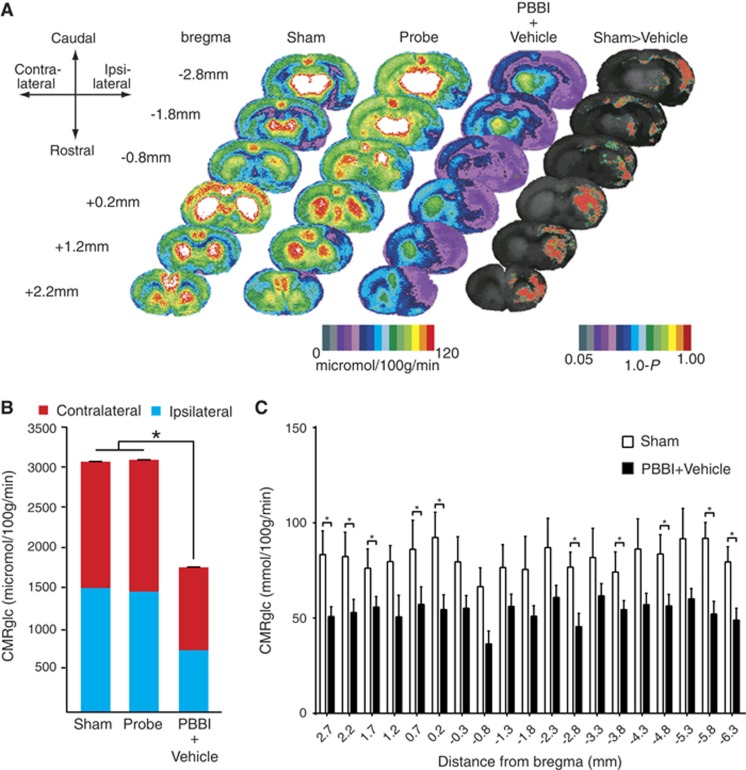
Figure 2.
Local cerebral glucose metabolism after penetrating ballistic-like brain injury (PBBI). (A) Color-coded maps of average local cerebral metabolic rate for glucose (LCMRglc) at 2.5 hours after injury. Each coronal section is a representation of multiple animals within a group: Sham n=4, Probe n=5, PBBI n=10. Atlas levels are given on the left column and represent the longitudinal distance between each section and the bregma in millimeters. Positive and negative values indicate distances in the anterior and posterior directions, respectively. Compared with controls (columns 1 and 2) in PBBI (column 3), LCMRglc decreased radially from injury core into perilesional areas and globally across the entire brain. In control (Probe only group), hypoglycolysis was limited to anterior half corresponding to the entrance route of the probe. P-maps of average local cerebral glucose utilization were produced by comparing the values of pixels corresponding to the same anatomic position across groups. The color-coded pixels shown here are those found to be significantly different (P<0.05) in a pairwise comparison between two groups (Sham versus PBBI). Greater-than symbols (>) indicate the directionality of the results. The P was subtracted from 1.0 so that the highest value on the scale represents P=0, and the lowest P⩾0.05. (B) Comparison of glucose utilization in whole brain between Sham and PBBI groups. There was a significant decrease in LCMRglc of whole brain between Sham and PBBI groups (P<0.05, n=4 to 5/group, ordinary one-way ANOVA). Greater impairment of glucose uptake was observed in the ipsilateral than the contralateral hemisphere. (C) Comparison of glucose uptake across rostrocaudal axis. There were significant decreases in LCMRglc between sham and PBBI groups in brain sections at 2.7 , 2.2, 1.7 , 0.7, 0.2, −2.8, −3.8, −4.8, −5.8, and −6.3 mm from bregma in the ipsilateral hemisphere (P<0.05, n=4 to 5/group, Multiple t-tests followed by Holm–Sidak method). *P<0.05 t-test followed by Holm Sidak.

