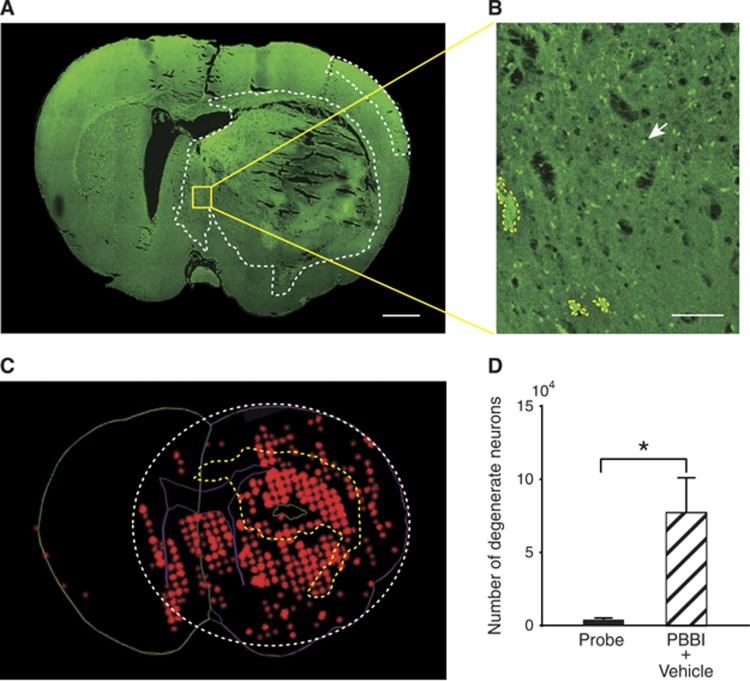
Figure 3.
Neurodegeneration after penetrating ballistic-like brain injury (PBBI). (A) A confocal image of a Fluorojade B (FJB)-stained coronal section at 0.8 mm distance from bregma shows regions with FJB+ cells (circumscribed by white-dotted line). Greater neurodegeneration was observed in the injury core and peri-injury zone in the ipsilateral than those in the contralateral cerebral cortex. (B) A higher magnification of the region outlined in (A) shows representative FJB+ cell (white arrow) and blood clot (circumscribed by yellow-dotted line). (C) The image represents various contours used for unbiased stereological quantification of FJB+ cells. The contralateral hemisphere is outlined in green. The ipsilateral hemisphere and lateral ventricles are outlined in purple. Red asterisks are used to mark individual FJB+ cells that appear as clusters. Intracranial hemorrhage is circumscribed by a yellow-dotted line. White-dotted line circumscribes the area containing FJB+ cells. Bar=1 mm (A), 100 μm (B). (D) Quantification of neurodegeneration after PBBI. There was a significant difference in the number of FJB+ cells between probe and PBBI groups in the ipsilateral hemisphere (P<0.05, n=6/group, Mann–Whitney test). *P<0.05, Mann-Whitney.

