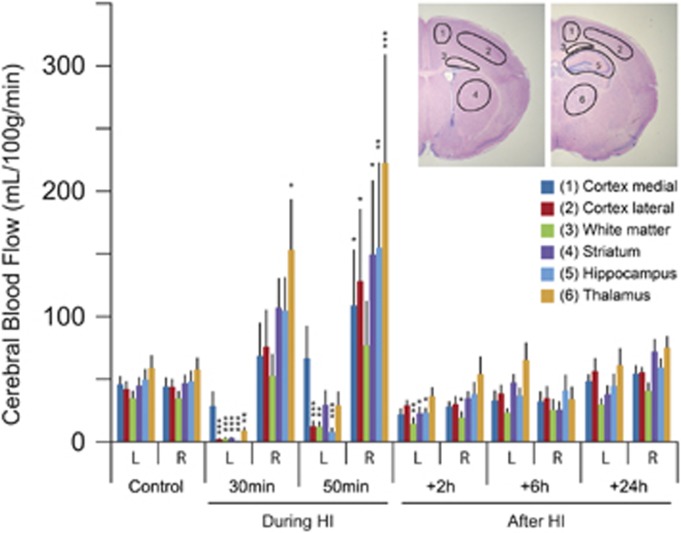
Figure 6.
Regional cerebral blood flow during and after neonatal hypoxia-ischemia (HI) from autoradiograms. Brain regions for blood flow measurements are outlined to the top right. This shows a reduction in all brain regions of left (ligated) hemisphere, except the medial parts of the cortex, compared with controls whereas in the contralateral hemisphere blood flow was higher than controls during HI. Blood flow after HI was somewhat lower in some brain regions at 2 hours after HI but restored to near normal at 6 and 24 hours after HI in all brain regions. For examples of autoradiograms see Figure 7. Data are mean±s.e.m., n=5 to 8/group; *P<0.05, **P<0.01, ***P<0.001 compared with controls (ANOVA followed by LSD). L, left (ligated) hemisphere; R, right hemisphere.

