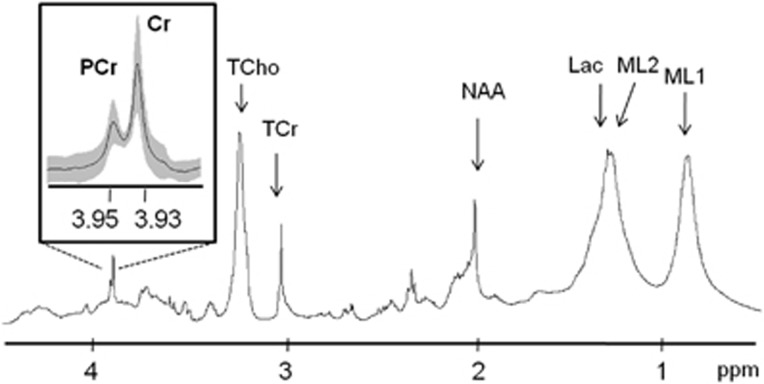
Figure 1.
Ex vivo HRMAS pulse-and-acquire mean spectra (n=12) of intact tissue areas at 37 ºC. The inset shows an expanded view of the phosphocreatine (PCr)–creatine (Cr) resonances. Mean spectra are in black and standard deviation is in gray shadow in the inset only. The other assigned metabolites correspond to: total choline (TCho), total creatine (TCr), N-acetylaspartate (NAA), lactate (Lac) and mobile lipids (ML1, ML2). HRMAS, high-resolution magic-angle spinning.

