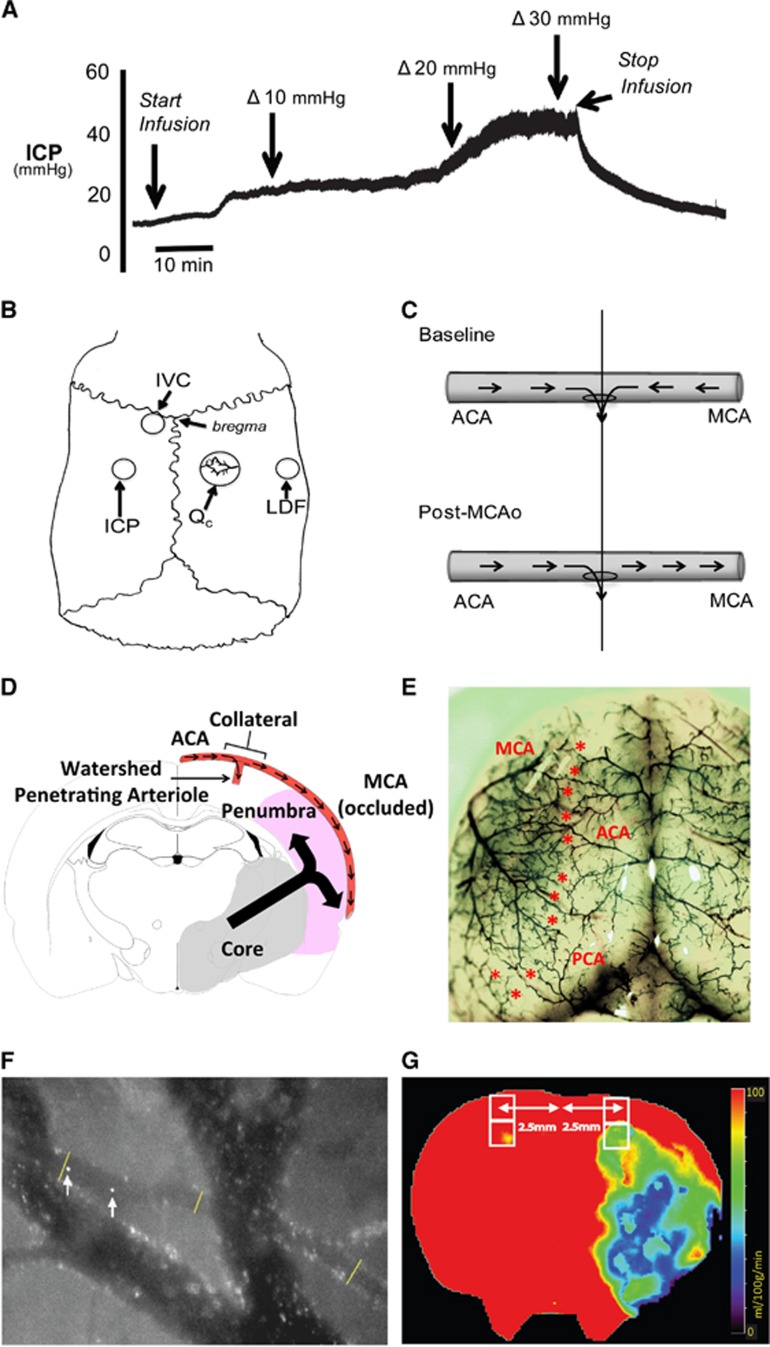
Figure 2.
Surgical and experimental procedures. (A) Representative intracranial pressure (ICP) trace. ICP was increased by infusion of artificial cerebrospinal fluid (aCSF) into the left lateral ventricle of a rat post-stroke. The infusion rate was increased stepwise from 4 μL/min to 40 μL/min. This resulted in an increase in ICP with no significant change in arterial blood pressure, so cerebral perfusion pressure (CPP) (not shown) mirrored ICP changes. (B) Schematic of skull surgery and monitoring: cranial window used to measure collateral flow (Qc), laser Doppler flow (LDF) probe to measure middle cerebral artery (MCA) perfusion, intraventricular catheter (IVC) for infusion of aCSF and ICP probe location. (C) Schematic of collateral blood flow direction before and after MCA occlusion (MCAo). The ‘watershed' penetrating arteriole at the confluence of the bidirectional collateral vessel blood flow (top panel) was used to demarcate the anterior (ACA) and middle (MCA) cerebral artery portions of the vessel (vertical line). This same landmark was also used after MCAo (bottom panel). Blood flow was measured in both ACA and MCA portions of the vessel at each imaging time point. (D) Schematic showing the relationship of the collateral and 'watershed' penetrating arteriole vessels in relation to infarct core and penumbra in the MCA territory at 2.3 mm behind bregma (corresponding to the center of the cranial window). Arrows within the blood vessel indicate direction of blood flow during MCAo. The large black arrow indicates direction of infarct expansion into the penumbra toward the collateral vessel. Area of infarction is based of infarct probability maps 24 hours after permanent MCAo in our model.23 (E) Rat cortical vasculature showing the location of pial collateral vessels (colored latex perfusion). Collaterals between the ACA and the MCA, and posterior cerebral artery and MCA are marked with asterisks. (F) Calculation of collateral vessel flow. Image shows two merged frames, taken 3.3 ms apart. A collateral vessel and larger bridging veins are seen. Arrows show the location of a microsphere at two time points—distance travelled between frames is used to calculate velocity; lines show locations of vessel diameter measurements. (G) Representative computed tomography perfusion (CTP) cerebral blood flow (CBF) map at bregma. Two regions of interest (ROIs) were fitted (white boxes) 2.5 mm lateral to midline in each hemisphere, corresponding to the location of the penetrating arterioles that are supplied by the collaterals imaged in study I. Perfusion was measured by taking the average CBF within these ROIs.

