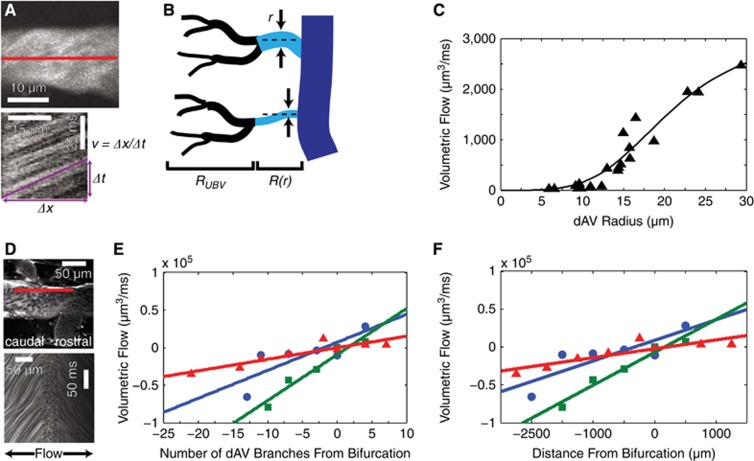
Figure 2.
In vivo blood flow measurements confirm an anatomy-driven flow model and reveal a bifurcation in flow direction along the dorsal spinal vein (dSV). Maximum intensity projections of small image stacks (A, top) and one-dimensional linescans at the center of the vessel (A, bottom) allow for volumetric flow measurements in dorsal ascending venules (dAVs). A simple flow model (B) considered dAVs (cyan) to have a composite resistance consisting of a radius-dependent resistance, R(r) and an average upstream branching venule (UBV) (black) resistance, RUBV. Representative data (C; symbols) and least-squares fit (solid line) show the correspondence between the model and measurements. Linescans at the edge of the dSV (D; top) were used to extrapolate speeds at the dSV center. A change in the slope of the linescan from positive (caudal-flowing) to negative (rostral-flowing) over the length scale of single linescan (D; bottom) shows a blood flow bifurcation in the dSV. Measurements (symbols) of dSV blood flow along with accompanying trend lines (solid lines) show an increase in magnitude of flow in either direction away from the bifurcation point both as a function of dAV branches (E) and geometrical distance (F). Colors correspond to individual animals (n=3 mice).

