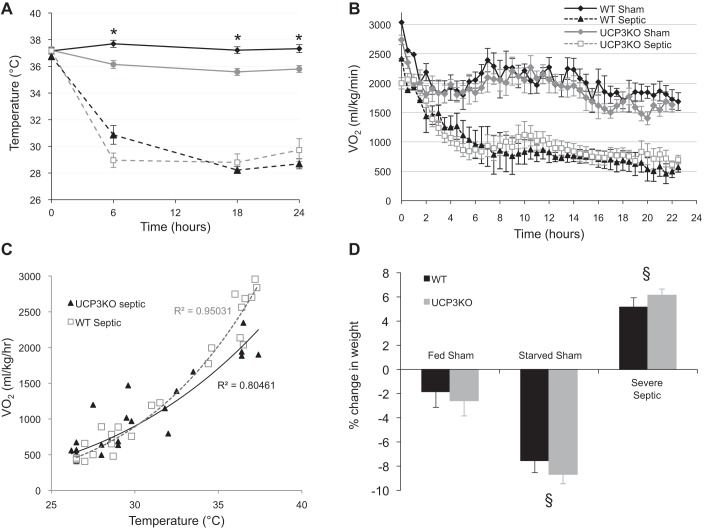
Fig. 3.
Temperature (A) and oxygen consumption (B) of WT and Ucp3−/− mice following induction of sepsis (or sham controls). C: plot of oxygen consumption against core temperature of WT and Ucp3−/− mice. Line of best fit and correlation coefficient are noted. D: percentage weight change of sham and septic mice over 24 h. Statistical significance (P < 0.05) was seen between groups in each genotype. All mice received sc fluid at 0-, 6-, and 18-h time points; food was withdrawn from starved sham mice immediately after ip injection of saline. *P < 0.05 compared with sham fed using 2-way ANOVA for temperature data over time, and 1-way ANOVA for weight data. §P < 0.05 2-way ANOVA comparing both genotypes with the other groups.

