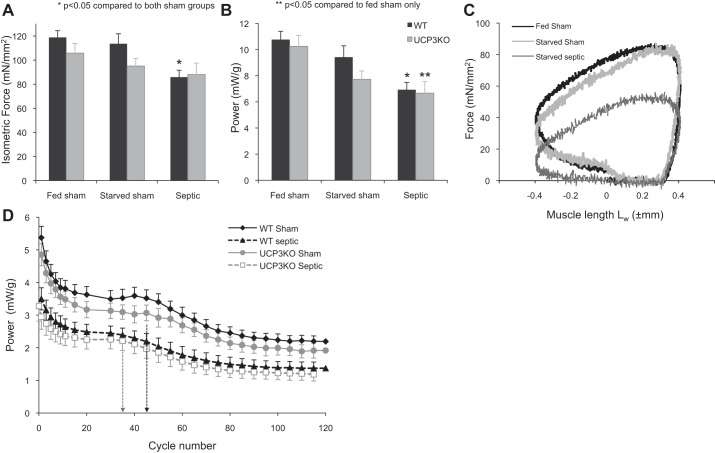
Fig. 5.
A: maximal isometric force generated by 350-ms tetanic stimulation in diaphragm strips taken from WT and Ucp3−/− mice and normalized to cross-sectional area. B: power generated by the muscle strips during sinusoidal length change at 4 Hz with phasic tetanic stimulation simulating in vivo muscle function. Power is expressed relative to muscle wet weight. C: example of a work loop generated by muscle strips from WT-fed sham, starved sham, and septic mice (optimal muscle lengths: 8.4, 9.5, and 9.7; muscle dry weight: 0.665, 0.627, and 0.578 mg, respectively). D: power performance of diaphragm strips taken from fed sham and septic WT and Ucp3−/− mice undertaking 120 repeated work-loop cycles at 2 Hz over a 1-min period. Values are the average power per cycle; for clarity, some values are not shown. The initial rapid decline is shallower, and the first plateau ends earlier (marked by broken vertical line), in the septic groups in both genotypes compared with the sham group. Values are means ± 1 SE.

