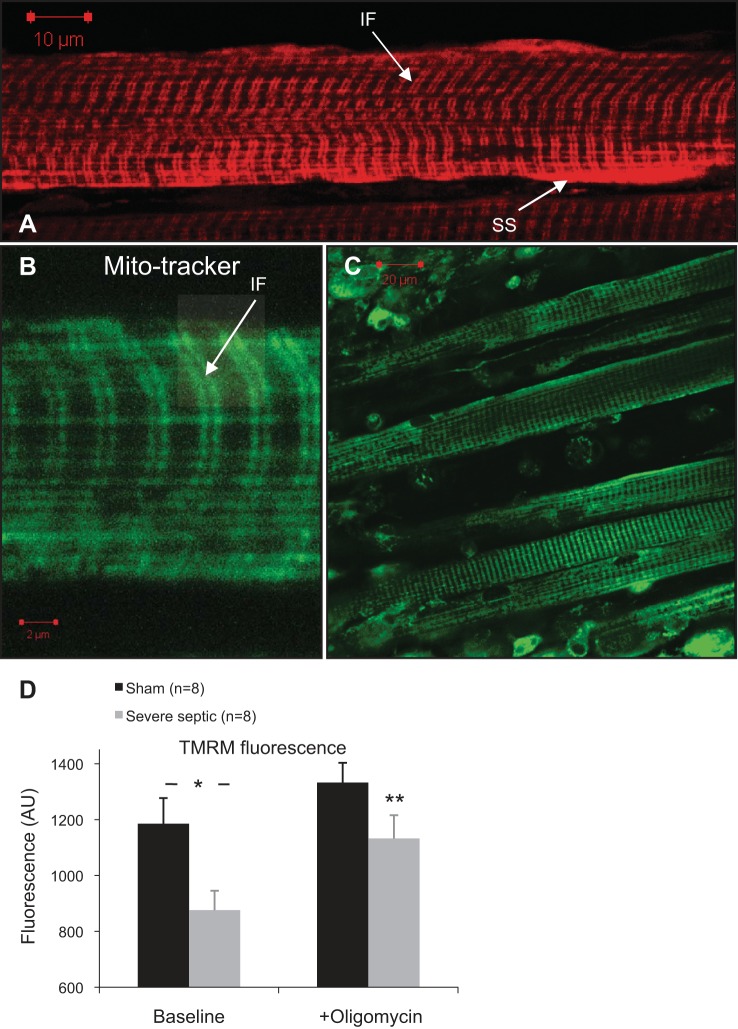
Fig. 7.
Live-cell images of tetramethylrhodamine methyl ester (TMRM, A) and Mitotracker green (B and C) fluorescence pattern in diaphragm muscle cells. Two distinct mitochondrial subpopulations of subsarcolemmal (SS) and intefibrillar (IF) are seen. Characteristic double-band pattern of interfibrillar mitochondria is shown in B (arrow). C: Z-stack 3-dimensional (3-D) image projection of a diaphragm strip loaded with Mitotracker green showing muscle and pleural cells on the surface. D: average TMRM fluorescence intensity of isolated diaphragm strips from sham and septic WT mice at 24 h bathed in 100 nM TMRM (baseline), and after addition of 5 μg/ml oligomycin (*P = 0.016 independent-sample t-test; **P < 0.01 paired t-test comparing fluorescence after oligomycin with baseline in the septic mice).

