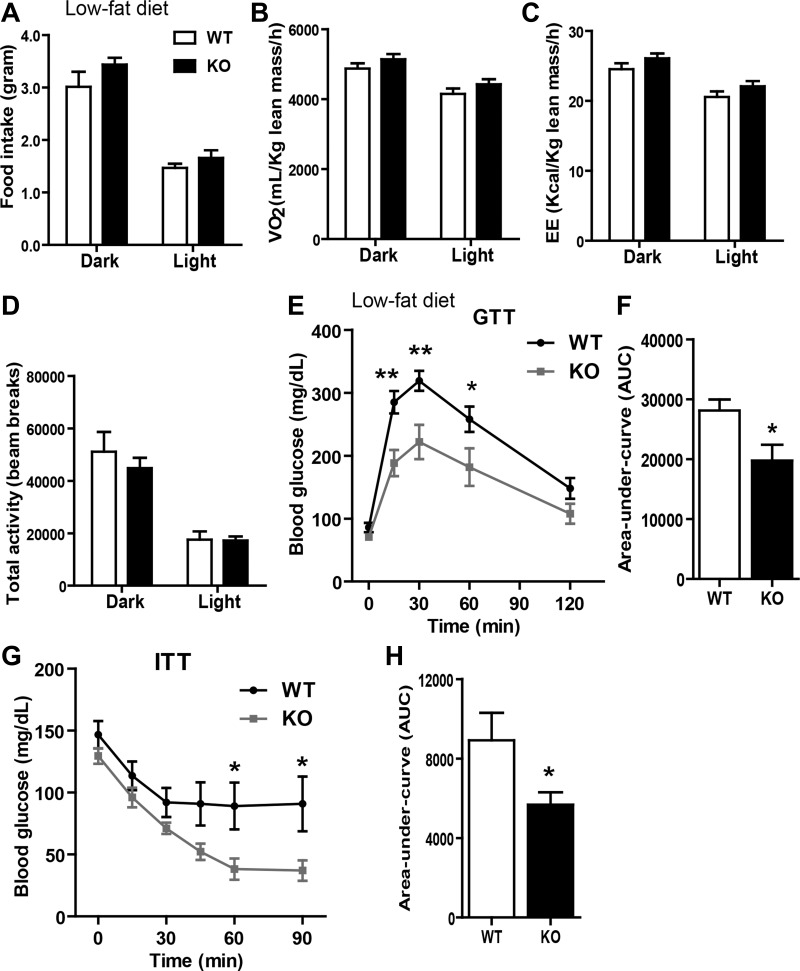
Fig. 3.
Tbxas deficiency improves glucose homeostasis in LFD-fed mice. A: food intake measurements of LFD-fed Tbxas WT and KO mice (n = 10). B–D: indirect calorimetry analysis of whole body oxygen consumption rate (V̇o2; B), energy expenditure (EE; C), and physical activity (D) of Tbxas WT and KO mice (n = 10). E: blood glucose levels in Tbxas WT and KO mice subjected to an intraperitoneal glucose tolerance test (GTT; n = 8). F: quantification of cumulative glucose clearance [area under the curve (AUC)], as shown in E. G: blood glucose levels in Tbxas WT and KO mice subjected to an insulin tolerance test (ITT; n = 8). H: quantification of cumulative glucose clearance (AUC), as shown in G. All data are expressed as means ± SE. *P < 0.05; **P < 0.01.

