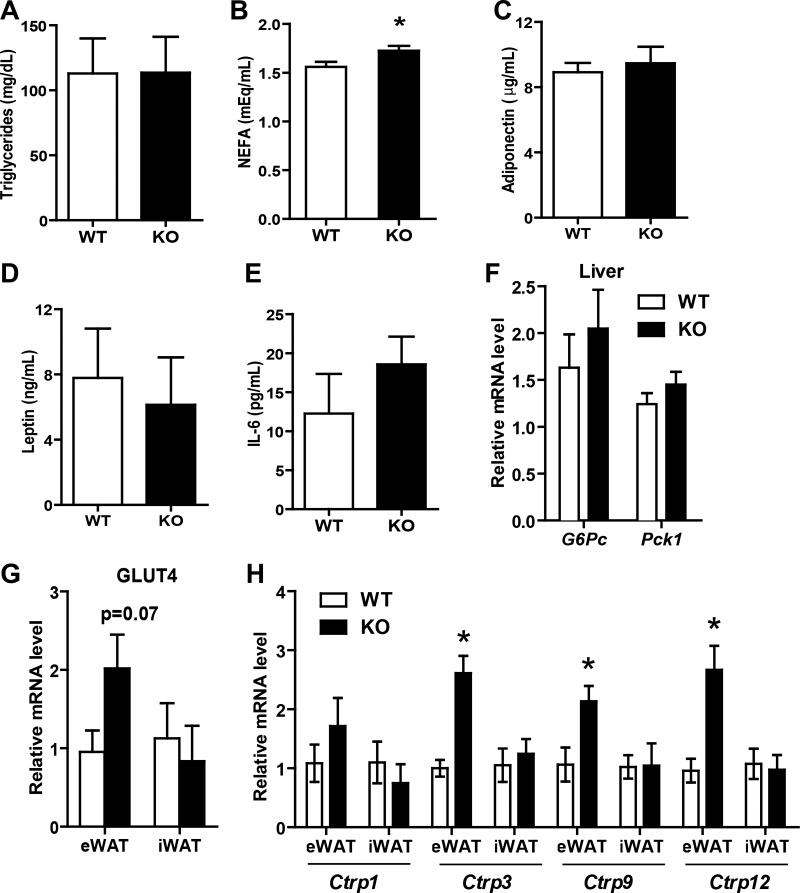
Fig. 4.
Serum metabolite and adipokine levels and metabolic gene expression in Tbxas KO mice fed a LFD. A–E: fasting serum triglycerides (A), nonesterified fatty acids (NEFA; B), adiponectin (C), leptin (D), and IL-6 (E) in LFD-fed Tbxas WT and KO mice (n = 10). F: expression of gluconeogenic genes (G6Pc and Pck1) in the liver of WT and KO mice (n = 10). G and H: expression of glucose transporter 4 (Glut4; G) and C1q/TNF-related protein (Ctrp; H) in eWAT and iWAT of WT and KO mice (n = 10). All data are expressed as means ± SE. *P < 0.05.

