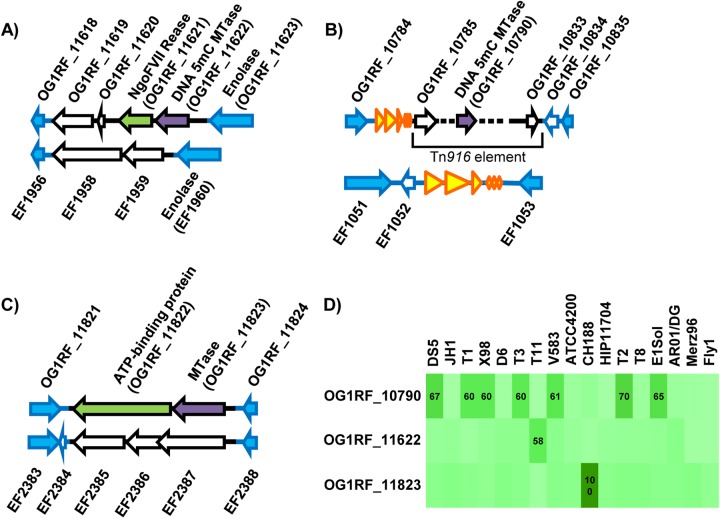
FIG 2.
Distributions of OG1RF DNA MTases in previously sequenced E. faecalis strains. (A to C) Analysis of synteny with E. faecalis V583. Genes shared with V583 are shown in blue. Genes with blue outlines and a white interior indicate V583 genes whose sequence is present in OG1RF but not annotated. Genes with black outlines are strain specific. DNA MTases are colored purple, and putative REases are green. Yellow arrows are rRNA and tRNA genes. (A) OG1RF_11622 region; (B) OG1RF_10790 region; (C) OG1RF_11823 region. (D) Occurrence of predicted OG1RF MTases in 17 previously sequenced E. faecalis strains. Pairwise alignments between each predicted OG1RF MTase and the entire protein complement from each of the other strains were performed using ClustalW. The intensity of the green shading indicates the percent amino acid sequence identity between query sequences and best hits, with darker green indicating greater sequence identity. The numbers shown are the percent amino acid sequence identity for best pairwise hits. Only values of ≥50% are shown.

