FIG 6.
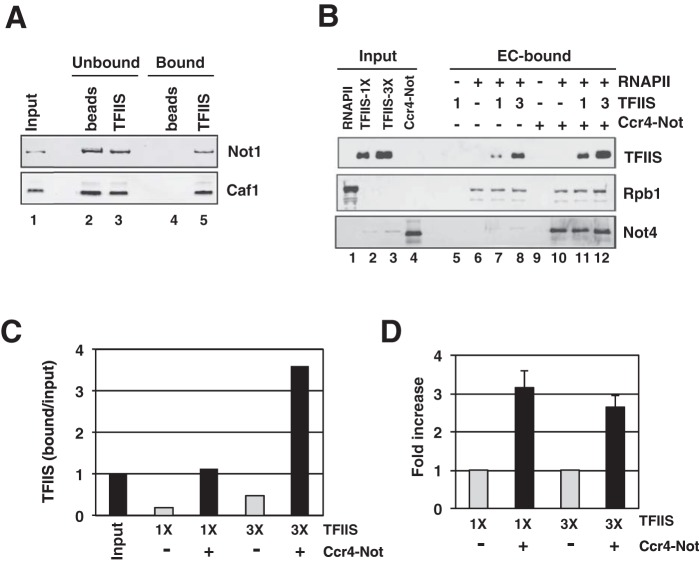
Ccr4-Not binds TFIIS and enhances the recruitment of TFIIS into elongation complexes. (A) Pulldown assay with purified Ccr4-Not complex. Approximately 5 μg of purified TFIIS protein was immobilized on Ni-NTA beads and incubated for 1 h with 1 μg of Ccr4-Not. Half of the total of each fraction was loaded onto an SDS-polyacrylamide gel and analyzed by Western blotting using Not1 and Caf1 polyclonal antibodies. Naked beads were used as a control in the experiment. Protein bands were detected using a Cy5-conjugated secondary antibody and fluorescent imagining. Purified Ccr4-Not (200 ng of protein) was loaded in the input lane of the gel. (B) Binding of TFIIS to immobilized ECs. Elongation complexes were formed on a biotinylated DNA template in the presence of O-me-GTP using 500 fmol of yeast RNAPII for 20 min. Purified Ccr4-Not (1.2 μg) was added to the reaction mixture, followed by the addition of 600 (1×) or 1,800 (3×) fmol of TFIIS for 5 min. BSA was added to make up for the differences in the amount of the protein in the binding reaction. Beads were magnetically collected and washed thoroughly, and the proteins were released by nuclease digestion. Proteins were separated by SDS-PAGE and analyzed by Western blotting using anti-6His (TFIIS), anti-Not4, and anti-Rpb1 monoclonal antibodies. Protein bands were detected using a Cy5-conjugated secondary antibody. The bands in lanes 2 and 3 of the Not4 blot likely results from the cross-reaction of the antibody with an E. coli protein in the TFIIS preparations. There were unloaded lanes between the input and bound samples; these are not numbered. (C) Quantification of the binding of TFIIS to ECs from the gels shown in panel B. Signals in the bound lanes were compared to those obtained with a fixed amount of input on the gel (B, lane 2), which was set equal to a value of 1. (D) Average recruitment of TFIIS in ECs. The amount of TFIIS bound to ECs in the absence of Ccr4-Not for each experiment was set equal to 1.0, and the average fold increase in the presence of Ccr4-Not was calculated from three experiments. The error bars represent standard deviations. As in panels B and C, 1× and 3× designate the amount of TFIIS used in the binding assays.

