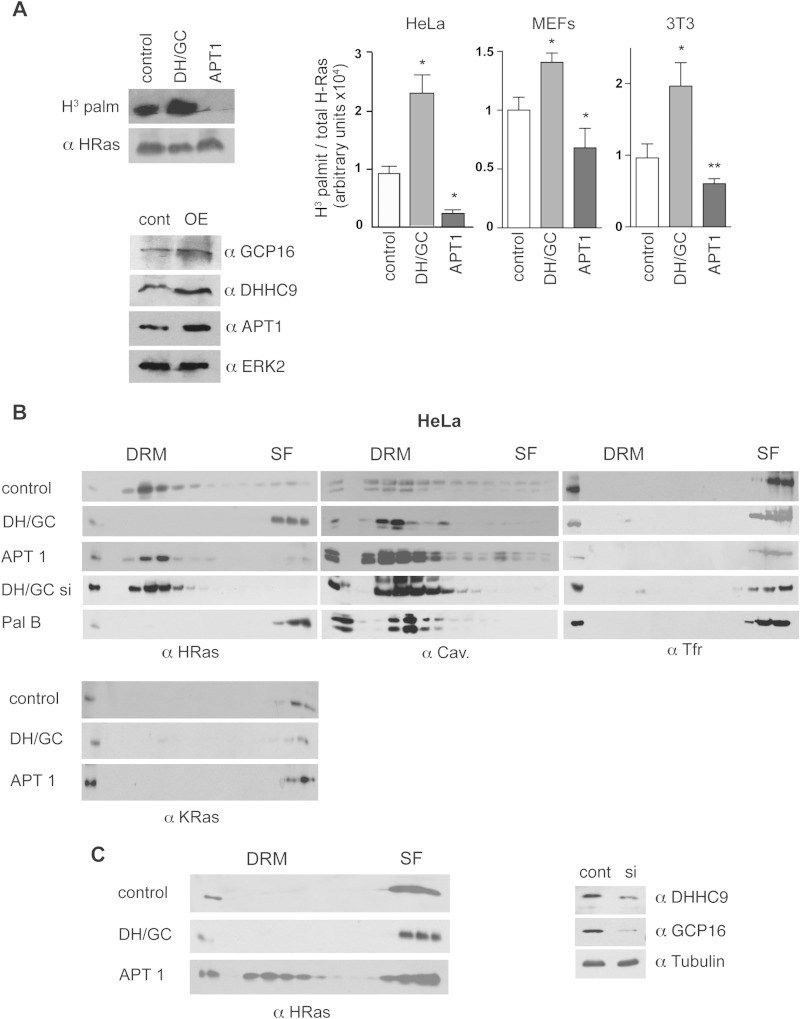
FIG 7.
Acylation/deacylation balance determines H-Ras PM distribution. (A) (Left, top) Effects of the overexpression of APT-1 and DHHC9/GCP16 (1 μg) on H-Ras palmitoylation levels in NIH 3T3 cells. The blots show the levels of H-Ras into which [3H]palmitate (H3 palm and H3 palmit) was incorporated and total H-Ras in anti-H-Ras immunoprecipitates. (Left, bottom) Levels of AT and PAT expression in control and H-Ras-overexpressing (OE) NIH 3T3 cells. (Right) Quantification of H-Ras palmitoylation levels in the indicated cell lines. Bars show the average ± SEM from three independent experiments. *, P < 0.05 with 95% confidence intervals; **, P < 0.005 with 95% confidence intervals. (B) Distribution of endogenous H-Ras and K-Ras analyzed in serum-starved HeLa cells transfected with APT-1 and DHHC9/GCP16. (C) (Left) The distribution of endogenous H-Ras analyzed in MEFs was determined as described in the legend to panel B. (Right) Levels of AT and PAT expression in control and siRNA-transfected HeLa cells. DH/GC, DHHC9/GCP16; cont, control; DH/GC si, siRNA against DHHC9/GCP16; Pal B, palmostatin B, si, siRNA.

