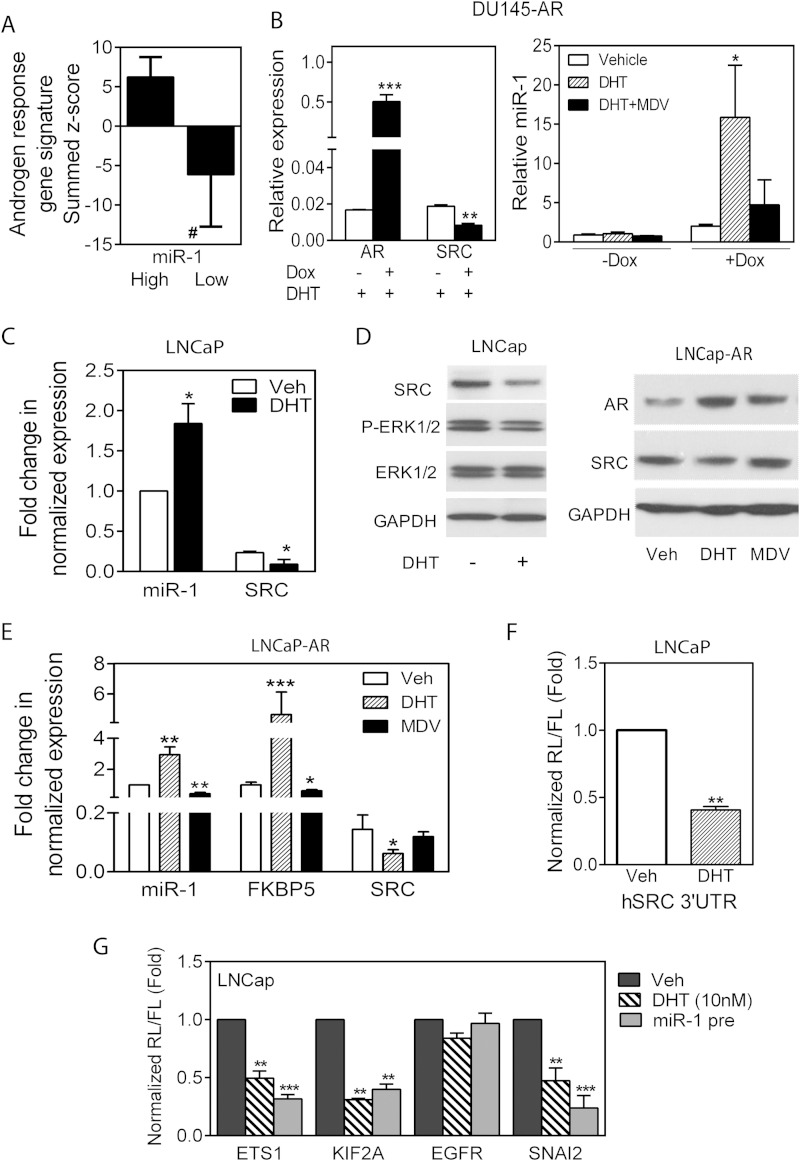
FIG 4.
AR positively regulates miR-1 and negatively regulates SRC levels. (A) AR regulated signature genes expressed as a summed Z score for samples separated on the basis of miR-1 expression above the median (High) or below the median (Low) in the MSKCC data set. #, P < 0.0001. (B) qPCR determination of AR and SRC levels in DU145-AR cells without (−) or with (+) doxycycline (Dox) in the presence of 10 nM DHT (left) and relative miR-1 levels in control or doxycycline-induced cells treated with vehicle, DHT (10 nM), or DHT and MDV3100 (10 μM) (right). (C) Fold change in normalized miR-1 and SRC RNA levels in LNCaP cells treated with vehicle or DHT (10 nM). (D) Western blot analysis of various proteins in extracts from LNCap cells treated with DHT (left) and LNCap/AR cells treated with DHT or MDV3100 (right). (E) Fold change in normalized miR-1, FKBP5, and SRC RNA levels in LNCaP-AR cells treated with vehicle, DHT, or MDV3100. (F) Normalized reporter activity for the SRC 3′-UTR following transfection into LNCaP cells and treatment with vehicle or DHT. (G) Normalized activity in LNCaP cells of miR-1 target reporters containing a full-length human ETS1, KIF2A, EGFR, or SNAI2 3′-UTR. Cells were treated with or without DHT (10 nM) for 48 h or transfected with pre-miR-1. For panels B to G, all treatments were for 48 h. Data are means and SEM for separate treatments (n = 3). *, P < 0.05, **, P < 0.01, and ***, P < 0.001, versus vehicle.

