
Figure 1.
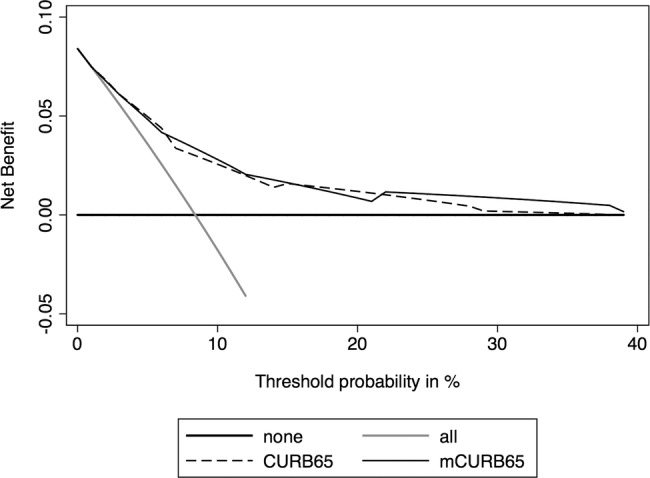
Decision curves for the CURB-65 and modified CURB-65 (mCURB-65) to predict 30-day mortality in patients with suspected sepsis. The thick black line is the net benefit of treating no patients, assuming that all would be alive; the thin grey line is the net benefit of treating all patients similarly regardless of their severity, assuming that all would die; the long dashed line is the net benefit of treating patients according to the CURB-65 score; and the thin black line is the net benefit of treating patients based on the modified CURB-65 score.