Abstract
The mucosal layer of the colon is a unique and dynamic site where host cells interface with one another and the microbiome, with major implications for physiology and disease. However, the cellular mechanisms mediating colonic regeneration, inflammation, dysplasia, and dysbiosis remain undercharacterized, partly because the use of thin tissue sections in many studies removes important volumetric context. To address these challenges in visualization, we have developed the deep mucosal imaging (DMI) method to reconstruct continuous extended volumes of mouse colorectal mucosa at cellular resolution. Use of ScaleA2 and SeeDB clearing agents enabled full visualization of the colonic crypt, the fundamental unit of adult colon. Confocal imaging of large colorectal expanses revealed epithelial structures involved in repair, inflammation, tumorigenesis, and stem cell function, in fluorescent protein-labeled, immunostained, paraffin-embedded, or human biopsy samples. We provide freely available software to reconstruct and explore on computers with standard memory allocations the large DMI datasets containing in toto representations of distal colonic mucosal volume. Extended-volume imaging of colonic mucosa through the novel, extensible, and readily adopted DMI approach will expedite mechanistic investigations of intestinal physiology and pathophysiology at intracrypt to multicrypt length scales.
Keywords: imaging, clearing, intestine
a major goal of biology is to understand how single cells build structure and function across large volumes of tissue. This unifying understanding is particularly important in the colorectal mucosa, where abnormal functions or interactions of various host and microbial cell types can lead to pathologies, such as ulceration, inflammation, and tumorigenesis, that affect macroscopic regions. To achieve improved visualization of biological processes, one powerful approach is to chemically “clear” the tissue of interest (i.e., normalize refractive indexes within the tissue, making it transparent), thereby enabling through deep confocal fluorescence imaging the study of cellular structures within their native tissue context. The promise of tissue clearing has been demonstrated in a variety of systems, including the nervous system (12, 13), intestines (15), kidney (7), airway (34), and vasculature (23); however, early clearing agents had important limitations such as their insufficient clearing, distortion of tissue architecture, quenching of fluorescent proteins, or proprietary recipes leading to exorbitant cost. These limitations have been partly alleviated by the development of newer clearing agents and approaches, such as ScaleA2 (17), SeeDB (19), CLARITY (6), CUBIC (37), and PACT (44), which overall support the utility of tissue clearing in reconstructing organ architecture using deep, single-photon confocal imaging. However, experimental workflows incorporating the use of clearing agents need to be developed for each organ and must consider the chemical properties of each clearing agent. Moreover, in murine colorectal mucosa it has not been fully determined what normal and pathological structures can be elucidated using a clearing methodology.
We report here a series of dissection, clearing, and imaging methods, collectively termed deep mucosal imaging (DMI), that enable complete optical reconstruction of large volumes of mouse distal colonic mucosa at cellular resolution. Usage of two clearing agents, ScaleA2 (17) and SeeDB (19), first described in brain effectively cleared distal colonic mucosal tissue such that the intestinal crypt could be visualized from its base up to the luminal surface in whole mount preparations. To facilitate investigation of large tissue volumes, we combined tissue clearing with tiled image acquisition. We provide software routines to manage the large image files. We show that DMI facilitates the visualization of colonic epithelial structures involved in acute injury, chronic inflammation, and tumorigenesis. The DMI technique excels when analyzing genetically modified fluorescent reporter mice and can be extended to study human colonic biopsy specimens and archived tissue. We believe that the incorporation of DMI will enhance mechanistic studies of colorectal function and dysfunction and that the principles of this technique will extend to studies along the entire gastrointestinal tract.
MATERIALS AND METHODS
Mice
Mice were maintained humanely and ethically, in accordance with the rules and regulations of the Institutional Animal Care and Use Committee (IACUC) of Children's Hospital Los Angeles (CHLA). This study was approved by the CHLA IACUC under the internal protocol number 288. Before dissection, mice were anesthetized with isoflurane and killed via cervical dislocation.
Lgr5::EGFP-IRES-CreERT2 mice (2), Rosa26::tdTomato (Ai14) mice (25), mTmG mice (29), and IL-10−/− mice on the C57Bl/6J background were obtained from Jackson Laboratory. Lgr5::EGFP-IRES-CreERT2 were bred with Ai14 mice to generate Lgr5trace mice. Single intraperitoneal injections with 20 μg tamoxifen (Sigma) prepared in corn oil were performed on these mice to induce lineage tracing for trace durations of 7–56 days.
Dextran Sulfate Sodium Injury Model
Before dextran sulfate sodium (DSS) injury, mice were trained to drink solely from water bottles by removing other sources of water for 1–3 days. To induce injury, mice were supplied with water bottles containing 3% wt/vol DSS (36–50 kDa mol mass; MP Biomedicals) in distilled water, which served as their only source of drinking water for 6 days. During the recovery period (after injury), mice were removed from the DSS source and were switched to regular drinking water. Mouse weight and stool consistency were periodically examined to validate onset of colonic injury.
Human Tissue
Deidentified incidental pediatric human colonic tissue was collected in the course of necessary intestinal resection surgery in a patient at CHLA. Tissue was transferred to the research laboratory following all regulations. The human colonic specimen was fixed in 4% paraformaldehyde (PFA) in phosphate-buffered saline (PBS) at 4°C for ∼6 mo before use in experiments. Mucosal biopsy specimens were obtained from this fixed specimen using a pediatric Radial Jaw biopsy forceps (2.0 mm; Boston Scientific).
Paraffin-Embedded Mouse Tissue
Paraffin-embedded blocks of colonic tissue were obtained from mice subjected to the azoxymethane (AOM)/DSS tumorigenesis model from a previous study (11). Excess paraffin was trimmed from the tissue and melted at 60°C. The freed tissue was sequentially incubated in 100% xylenes, 100% xylenes, 100% ethanol, 70% ethanol, 50% ethanol, 20% ethanol, distilled water, and PBS (10 min each).
Dissection
Whole colon was removed from dead mice. Colons were opened longitudinally and rinsed of fecal contents, flattened, and fixed overnight in freshly prepared, methanol-free 4% PFA in PBS at 4°C. After three rinses in PBS, the distalmost 3–5 cm of colon was removed for further dissection. In both freshly fixed and paraffin-restored distal mouse colonic tissue, the myenteric layer was carefully freed from the mucosal layer under a dissecting microscope using fine forceps and microvannas scissors.
Histochemistry
Primary antibodies included rabbit anti-MPO (1:300, catalog no. ab45977; Abcam), rabbit anti-MUC2 (1:100, catalog no. sc-15334; Santa Cruz Biotechnology), and rat anti-CDH1 (1:200, catalog no. 13-1900; Life Technologies). Secondary antibodies included a goat anti-rabbit Alexa Fluor 555 conjugate (8 μg/ml; Life Technologies) and goat anti-rat Alexa Fluor 555 conjugate (8 μg/ml; Life Technologies).
For immunostaining, isolated contiguous murine distal colonic mucosal samples or human biopsies were permeabilized for 4 h at room temperature with PBTx-block-0.3% Triton X in PBS supplemented with 4% horse serum (Vector Labs). Samples were incubated with primary antibody for 60 h at 4°C in PBTx-block. Following four washes with PBS (1 h each), tissue was simultaneously incubated with secondary antibody and 5 μg/ml Hoechst 33342 (Life Technologies) or 0.2 μM TO-PRO-3 iodide (Life Technologies) in PBTx-block at 4°C overnight. After being washed with PBS (4 times, 1 h each), samples were ready for SeeDB clearing.
For antibody-free labeling with various dyes before SeeDB clearing, tissue was incubated with 2 μg/ml Hoechst 33342, 0.2 μM TO-PRO-3 iodide, or 1 U/ml phalloidin-DyLight 488 conjugate (Thermo Scientific), or a combination of the three dyes, prepared in 0.3% Triton X in PBS for 1–3 days at 4°C. After being washed with PBS, samples were cleared in SeeDB (see below).
Clearing
ScaleA2.
ScaleA2 (17) aqueous solution contained 4 M urea, 0.1% wt/vol Triton X, and 10% wt/wt glycerol. Murine distal colonic mucosal strips were sandwiched between strips of blotting paper and skewered on a 30-gauge syringe needle before placement in ScaleA2. This setup prevented curling of specimens over time. All specimens were incubated in ScaleA2 at 4°C for >21 days. At 3 days before imaging, Hoechst 33342 or TO-PRO-3 iodide was added to ScaleA2 incubation solution to a working concentration of 5 μg/ml (Hoechst) or 0.2 μM (TO-PRO-3).
SeeDB.
Human and mouse specimens were placed in 20% wt/vol fructose/water solution and frozen at −20°C for 1–7 days. Upon defrosting, specimens were moved to 40% wt/vol fructose/water (1 h), 70% wt/vol fructose/water (1 h), and 100% wt/vol fructose/water (2–6 h) at room temperature. Specimens were moved to SeeDB solution for overnight incubation at room temperature. SeeDB (19) aqueous solution was composed of 80.2% wt/wt fructose and 0.5% vol/vol 1-thioglycerol. Some human biopsy samples were digested with 0.1% wt/vol collagenase D (Roche) in HEPES-buffered saline (in mM: 136 NaCl, 2.5 KCl, 10 HEPES, 2 CaCl2, 1.3 MgCl2, and 10 d-glucose, pH 7.4) at 37°C before clearing in SeeDB; this additional preprocessing step was tested for its ability to enhance penetration of SeeDB into heavily fixed tissue.
Mounting
ScaleA2-cleared samples.
Specimens were removed from ScaleA2 solution, dried on blotting paper, and flattened on no. 1 24 × 60 mm cover glass. Drops of ScaleA2 were added to rehydrate the specimen minimally; bubbles were gently pushed out of the specimen with a pipette tip. A no. 1 24 × 30 mm cover glass was placed on top of the specimen, and additional ScaleA2 was added with a transfer pipette through the side of the cover glass “sandwich.”
SeeDB-cleared samples.
Specimens were removed from viscous SeeDB and flattened on a no. 1 24 × 60 mm cover glass containing a drop of SeeDB preequilibrated with specimen. A no. 1 24 × 30 mm cover slip was added to the top to affix the specimen.
Imaging
Mounted samples were allowed to equilibrate in the mounting setup for 15 min before imaging. Samples were imaged on a Zeiss LSM700 confocal inverted microscope, with Fluar 5×/0.25 numeric aperture (NA), Plan-NeoFluar 10×/0.3 NA, or Plan-Apochromat 20×/0.8 NA air objectives. Pinhole size was set to 1 Airy unit. Tiled images were acquired with an overlap of 10%. Refractive index matching was performed within the Zen (Zeiss) software; refractive indexes of 1.38 and 1.45 were used for ScaleA2- and SeeDB-cleared samples, respectively. Typical scans were executed over a duration of 6–14 h.
Postprocessing of Images
Custom-written convenience plugins, based on the LOCI Bioformats library (22) and Fourier stitching algorithm (33), were developed in FIJI/ImageJ to handle acquired laser-scanning microscope (LSM) images. The set of plugins is open-source and publicly available on Github under the deep-mucosal-imaging project (github.com/stalepig/deep-mucosal-imaging). Briefly, tiled images were converted to serial TIFF stacks (using “Explode into tiles” plugin), resampled to <1.75 GB (using “Batch resizer” plugin), stitched (using “Stitch wrapper” plugin), and reconstructed to form a reference image (using “Combine image sequence” plugin). Plugins enabled exploration of subsections of the reference image at original (acquisition) resolution (“Explore full resolution”), illumination correction (“Normalize contrast over z”), compensation for bleedthrough (“Subtract bleedthrough”), and feature isolation with volume rendering (“Set cast”). All image analysis was performed on a standard 2.8 GHz/i7/8 GB desktop computer.
Analysis of DSS Injury
Quantification was performed on images using built-in measurement functions in ImageJ combined with interfacing routines in the DMI package. Luminal images of CDH1-labeled colorectal mucosa were thresholded, and the DMI plugin “Injury counter 2” automatically calculated the percent of negatively stained surface along the proximal-distal axis, which yielded a profile of the ulceration along the length of the mouse colon. The accuracy of the results was checked using the manual “Injury counter” function of the DMI package. To calculate the fractional surface occupancy of highlighted epithelial features (e.g., restitution, neoepithelium, aberrant crypt repair structures) in DSS recovery, regions of interest were manually traced from luminal z projections and subsequently sized and scaled to the total surface area. A full list of functions and use cases in the DMI package is provided in the software documentation.
Statistical tests and hierarchical clustering were performed in R.
RESULTS
Development of DMI
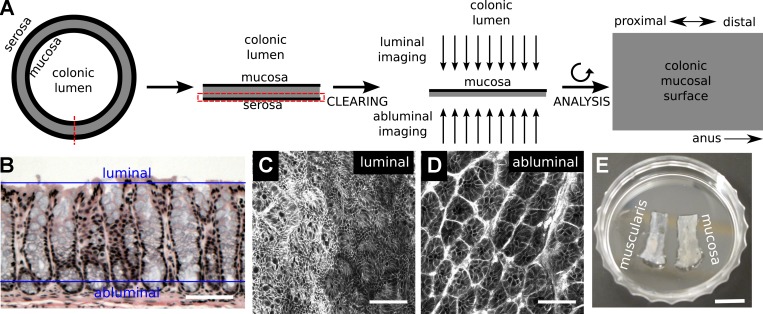
The DMI method combines physical isolation of colorectal mucosa with chemical clearing to enable deep (z plane) imaging of whole mounted specimens using single-photon confocal microscopy. Large expanses (x-y plane) of the opened mucosal surface could be captured in full z depth by tiling of acquired images (Fig. 1A). The x-y plane in acquired images was orthogonal to the conventional plane of tissue cross sections. In DMI, the microscope objective could be placed on the luminal side (luminal imaging) or submucosal side (abluminal/basilar imaging) to optimize resolution at the luminal surface or at the base of the intestinal crypt, respectively (Fig. 1, B–D). Because individual image data sets could exceed 25 GB, we developed open-source convenience routines to facilitate reconstruction and exploration of DMI images on computers with standard memory allotments (∼8 GB RAM), obviating the need for proprietary software or state-of-the-art hardware.
Fig. 1.
Deep mucosal imaging (DMI) is a workflow for imaging and reconstructing extended volumes of colorectal mucosa. A: the mouse colon is opened, and the mucosal layer is isolated, cleared, and imaged in a whole mount setup. B–D: the conventional plane of analysis in hematoxylin and eosin (H&E)-stained histological sections (B) is tangential to the luminal (C) and abluminal (D) planes in whole mount imaging of colons from mTmG mice (C and D). E: separation of the myenteric layer was essential for clearing in the distal colon and rectum. Scale bars: 50 µm (B), 75 µm (C and D), and 8.75 mm (E).
Application of Clearing Agents to Murine Colorectal Tissue
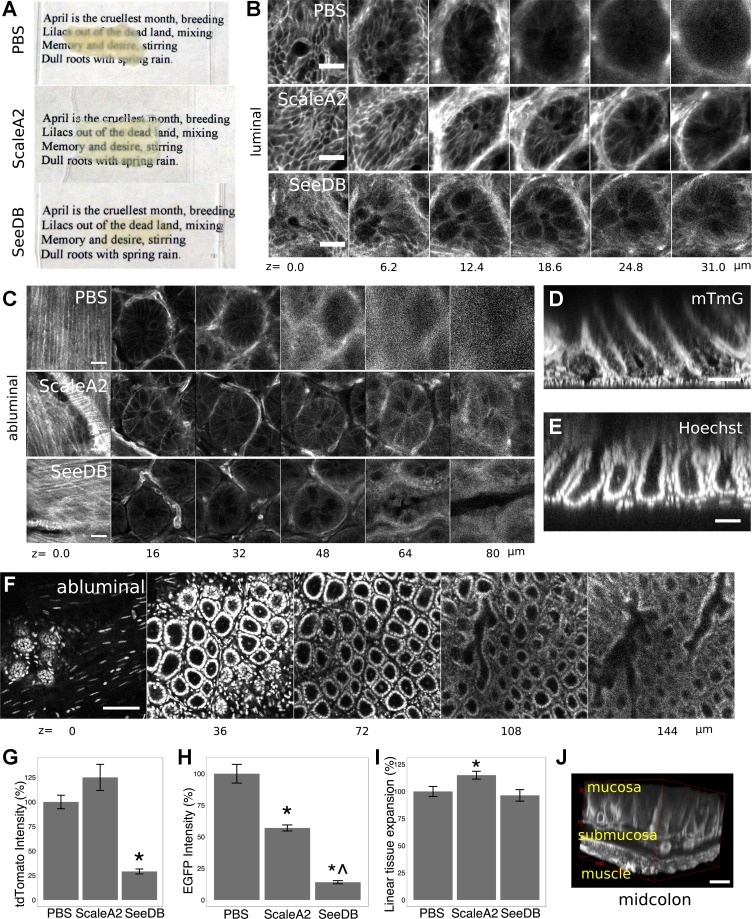
A major goal of the DMI technique was mucosal visualization through the full extent of the murine colonic crypt. In the distal colon and rectum, this required dissection of colonic muscle layers from the mucosa (Fig. 1E). We then tested the efficacy of chemical clearing agents on colorectal mucosa. Both urea-based (ScaleA2) and fructose-based (SeeDB) clearing agents (17, 19) reduced light scattering through mucosal tissue (Fig. 2A). Luminal microscopic images showed resolution of cleared, tdTomato-labeled cellular membranes (from mTmG mice; see Ref. 29) at >30 μm beneath the luminal surface, beyond the resolving depth in uncleared samples (Fig. 2B). In abluminal images, chemical clearing enabled resolution of tdTomato fluorescence in the colonic crypt fully from the basilar lamina propria to the mucosal surface (Fig. 2C). A digital orthogonal representation that emulated the classic tissue sectioning plane could be derived from abluminal DMI images (Fig. 2D). These orthogonal representations indicated that the practical z-resolution of the DMI technique was determined by the optical section thickness and pinhole size set during the z-stacking procedure. Although the z-resolution is fundamentally limited by the point-spread function, optical sectioning at ∼2-μm thickness with a 20×/0.8 NA objective yielded images with subcellular axial resolution. Cleared colonic crypts stained with exogenous Hoechst nucleus-labeling dye could also be reconstructed in abluminal images (Fig. 2, E and F).
Fig. 2.
ScaleA2 and SeeDB clear murine colorectal tissue. A–C: usage of ScaleA2 and SeeDB improved optical penetration through colorectal mucosal tissue, evaluated macroscopically (A) and microscopically in luminal (B) and abluminal (C) images showing native, membrane-localized tdTomato fluorescence from mTmG mice. The source tissue for SeeDB clearing in A was not as large as the control tissue in x-y size. D and E: abluminal images were used to generate orthogonal projections showing the axial resolution of tdTomato (D)- and Hoechst (E)-labeled structures. F: tissue was sufficiently cleared (shown: ScaleA2) to permit visualization of cellular nuclei from the base to the top of the colonic crypt in abluminal images. G and H: use of SeeDB caused a partial loss of membrane tdTomato fluorescence in mTmG mice (G), and both ScaleA2 and SeeDB caused partial loss of cytoplasmic enhanced green fluorescent protein (EGFP) fluorescence in Lgr5::EGFP-IRES-CreERT2 mice (H). Fluorescence comparisons were made by longitudinally cutting the colon into 3 strips, treating the strips with clearing agents or PBS, and then comparing crypt fluorescence in equivalent proximal-distal regions. I: tissue incubated in ScaleA2 expanded, as measured by comparing crypt cross-sectional areas in equivalent colonic regions. *P < 0.05, t-test, vs. PBS; ^P < 0.05, t-test, vs. ScaleA2. J: 3-dimensional (3D) reconstruction shows the SeeDB-cleared muscle and mucosal layers of midcolon. Error bars: SE. Scale bars: 20 (B and C), 50 (D and E), 100 (F), and 50 (J) μm. Nominal z-positions indicate depth from either the luminal surface (top of the crypt, luminal images) or the basilar plane (crypt base and submucosa, abluminal images).
We compared the effects of tissue clearing on preservation of fluorescent protein signal and tissue morphology. We imaged colonic crypts derived from equivalent regions along the proximal-distal axis in mTmG (n = 5 mice, >20 crypts/mouse) and Lgr5::EGFP-IRES-CreERT2 mice (2) (n = 3 mice, >20 crypts/mouse). Crypts were either treated with PBS, ScaleA2, or SeeDB. SeeDB clearing resulted in an approximately fourfold reduction in membrane-localized tdTomato fluorescence at the crypt base in mTmG mice (P < 0.01), whereas ScaleA2 had no impact (P = 0.1, Fig. 2G). Similarly, SeeDB significantly reduced cytoplasmic enhanced green fluorescent protein (EGFP) fluorescence of Lgr5::EGFP-IRES-CreERT2 at the crypt base (P < 0.01), and ScaleA2 clearing resulted in a more modest reduction (P = 0.01, Fig. 2H). However, the remaining fluorescence was still strong enough to perform deep imaging of cleared crypts and provided net benefit vs. uncleared samples (Fig. 2C). Crypt cross-sectional areas were larger in ScaleA2-cleared tissue from mTmG mice; we calculated that ScaleA2 led to a linear sample expansion of 15 ± 4% in each direction (P = 0.01, n = 5 mice, >20 crypts/mouse). SeeDB did not alter the apparent crypt size (Fig. 2I). Clearing of colorectal mucosa required a 21-day incubation in ScaleA2 or a 1-day incubation in SeeDB. With SeeDB, the typical time from animal dissection to imaging was 5 days, and a 12 × 8 × 0.6 mm3 volume of distal colonic tissue could be imaged in <16 h and digitally processed in <24 h. Imaging of more-proximal regions of colon was possible with the same clearing protocol; in midcolon, myenteric separation was not necessary to visualize colon fully with SeeDB clearing (Video 1 and Fig. 2J).
Reconstruction and Immunostaining of Normal Mouse Colon
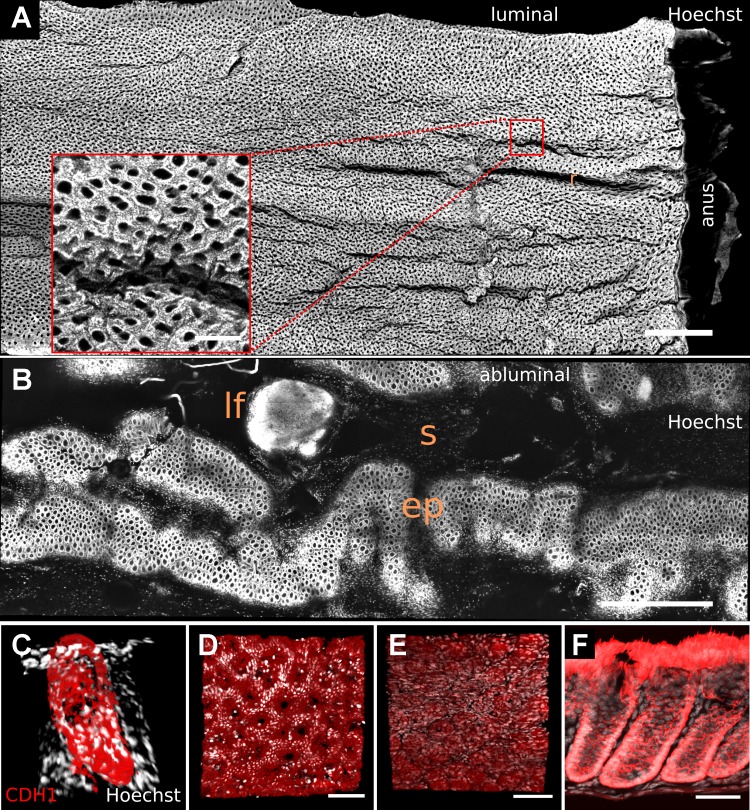
When stained for cellular nuclei, the normal adult murine distal colon exhibited a continuous array of crypts that had a grossly uniform appearance (Video 2) on the folded luminal mucosal surface. The continuous array of crypts terminated at the far-distal dentate line bordering the anal squamous epithelium (Fig. 3A). In abluminal image stacks, the mesenchymal cell layer surrounding the crypt base, as well as portions of the submucosa, were the first layers to appear. Because of the contoured structure of the mucosa, the crypt bases were not all in the same z plane (Fig. 3B). These images show that, in addition to resolving individual cellular nuclei (Fig. 2F), DMI revealed the architectural patterns within colorectal tissue.
Fig. 3.
Tiling of images allowed visualization of large proximal-to-distal expanses of SeeDB-cleared normal mouse colon. A: representation of mucosal surface stained with nucleus-labeling dye (Hoechst 33342) in luminal images shows crypt openings as holes. The rugae (“r”) of the 3D surface are also visible. B: a single z plane in the abluminal image illustrates embedding of lymphoid follicles (lf) within submucosa (“s”) and epithelium (ep). Inset in A shows a region of interest at native acquisition resolution. C–F: images show staining for CDH1 (red) and cellular nuclei (white) in normal mouse colon, in a 3D orthogonal reconstruction of a digitally isolated crypt (C), in luminal (D) and abluminal (E) surface representations, and in tissue that was mechanically sectioned after whole mount staining (F). Scale bars: 1,000 (A and B), 150 (inset), 75 (D and E), and 50 (F) μm. CDH1, E-cadherin.
We next examined whether tissue clearing could enhance whole mount visualization of antibody-labeled samples. Figure 3C shows a three-dimensional (3D) reconstruction of SeeDB-cleared, digitally isolated colonic crypt labeled with an antibody raised against CDH1 (E-cadherin). Luminal (Fig. 3D) and abluminal (Fig. 3E) images showed prominent membrane labeling by the CDH1 antibody at the luminal surface and crypt base, respectively. To examine the extent of antibody penetration in the colonic crypt, we washed out the clearing agent from the immunostained samples and analyzed them using mechanical sectioning: the images confirmed full CDH1 labeling throughout the basilar-luminal axis of the crypt (Fig. 3F). These results demonstrate that DMI can be easily incorporated into an integrated experimental workflow that includes immunohistochemistry and mechanical sectioning.
DMI for Lineage Tracing of Epithelial Stem Cells
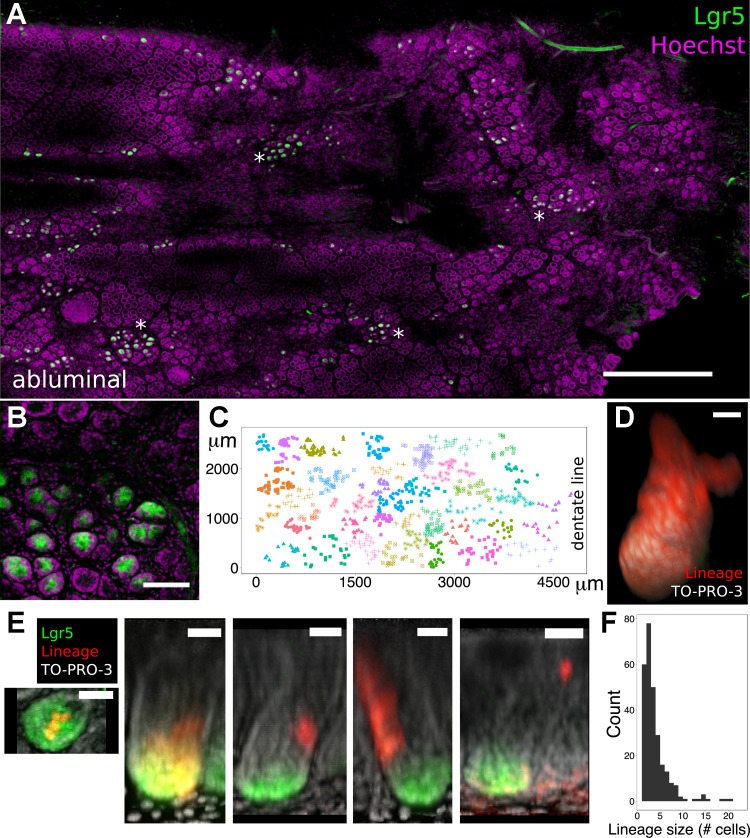
Because chemical clearing with ScaleA2 or SeeDB preserves native fluorescence of fluorescent proteins in gut (Fig. 2), the DMI method facilitates the 3D analysis of the functions of fluorescently tagged, rare cells in mouse models. To demonstrate this principle, we analyzed the locations and lineages of colorectal epithelial stem cells in Lgr5::EGFP-IRES-CreERT2; Rosa26::tdTomato (Lgr5trace) mice, in which EGFP and Cre recombinase coexpression in Lgr5+ stem cells enables their native visualization (through imaging for EGFP) and tamoxifen-inducible lineage tracing (2, 25) (through hereditary cytoplasmic tdTomato expression). These Lgr5 reporter mice exhibit a well-documented mosaic expression pattern, in that EGFP expression is only found in a minority of intestinal crypts despite the presence of Lgr5+ stem cells in all of them (2, 39). Because of worsening mosaicism at progressively distal locations in the gastrointestinal tract (2), few studies (9, 27) have analyzed Lgr5+ stem cells specifically in colorectal mucosa, in spite of their potential importance in tumor growth and tissue regeneration.
DMI-derived images permitted visualization of >5,000 distal colonic crypts within a single sample (Fig. 4A). In the distalmost 1 cm of colons from 10 mice, 10.6 ± 1.4% of crypts harbored EGFP+ cells. Computerized hierarchical clustering demonstrated that the x-y locations of crypts with EGFP+ cells were grouped (Fig. 4, B and C). We next tested the suitability of DMI to visualize the 3D lineages of colonic Lgr5+ stem cells (Video 3). In Lgr5trace mice, pulse tamoxifen injections at a dosage of 0.02 mg/animal induced the hereditary expression of tdTomato in an average of less than one stem cell per crypt (24). After an 8-wk lineage-tracing period, clonal conversion was observed as fully labeled crypts that could be reconstructed in 3D (n = 3 mice, Fig. 4D). Performing a similar pulse-chase analysis (n = 5 mice), but with a shorter chase period (7 days), enabled the visualization of the lineages of single stem cells before clonal fixation (42). Figure 4E shows these lineages occupying stem cell, transit-amplifying, and differentiated cell zones of the colonic crypt. The absolute sizes of these clonal lineages could also be directly quantified; their aggregated statistical distribution (n = 5 mice, 276 total crypts analyzed) is shown in Fig. 4F. Thus, DMI facilitates 3D lineage-tracing analysis throughout both stem- and differentiating-cell compartments in the mosaic Lgr5trace mouse colon.
Fig. 4.
DMI enhanced 3D lineage tracing from Lgr5+ colonic epithelial stem cells. A: single z plane from an abluminal image of Lgr5::EGFP-IRES-CreERT2; Rosa26::tdTomato (Lgr5trace) mouse distal colon shows clusters of Lgr5+ crypts (*). B: close-up maximum intensity projection of the crypt base shows a cluster of Lgr5+ crypts. C: automated hierarchical clustering identified discrete spatial clusters of Lgr5+ crypts. Individual dots represent locations of single crypts with EGFP+, Lgr5+ stem cells; dot colors differentiate computationally identified clusters. D: 8-wk lineage tracing initiated by 0.02 mg tamoxifen resulted in fully labeled colonic crypts, as depicted in the 3D reconstruction. E: 1-wk lineage tracing started by 0.02 mg tamoxifen revealed a variety of clones, encompassing cells at the crypt base, basilar transit-amplifying (TA) zone, TA zone, TA-differentiated region, and differentiated-cell regions (left to right). F: shown is the composite histogram of clone sizes from 5 mice. Scale bars: 750 (A), 75 (B), 20 (D), and 30 (E) μm. Clearing, ScaleA2.
Visualization of Injury and Regeneration in Chemically Injured Colon
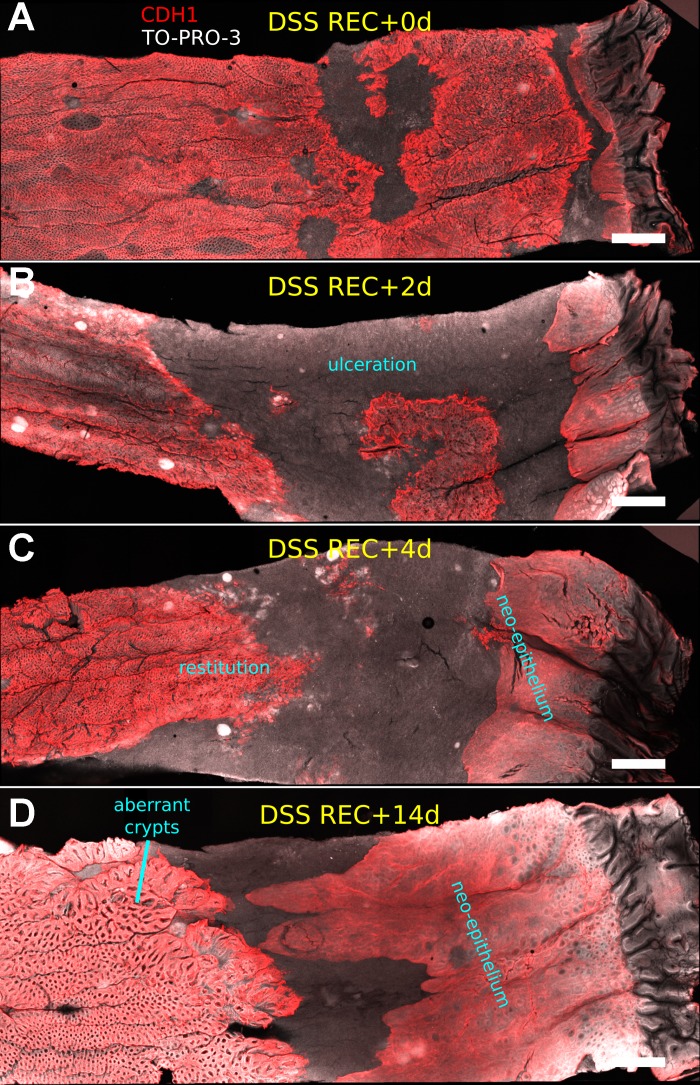
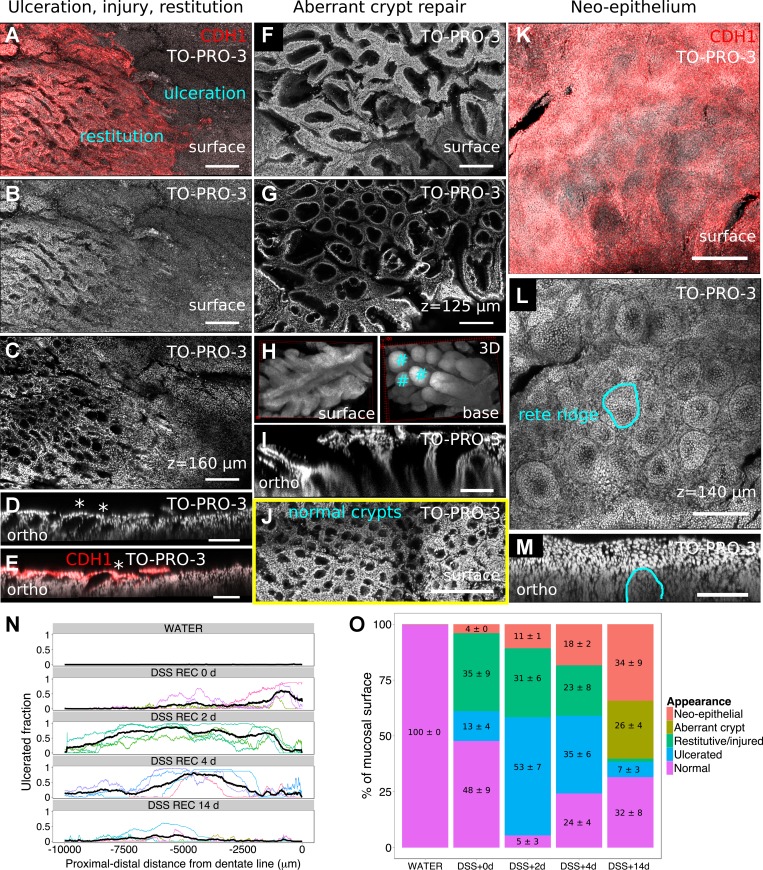
Using DMI, we reconstructed the distal colons of mice administered 3% DSS through drinking water. The consumption of DSS over several days induces reversible epithelial destruction and inflammation of distal colon (31). We imaged samples of the distalmost 1 cm of colonic mucosa at 0, 2, 4, and 14 days into the “recovery” period, after the withdrawal of DSS, and compared them with samples from untreated controls (n = 4 mice/cohort). Figure 5 shows representative images of DSS-induced ulceration at these time points on the CDH1-immunostained distal colonic epithelial surface. Reproducible epithelial features found in every sample at the given time point are described and shown in greater detail in Fig. 6. The spatial profiles of ulceration and regenerative epithelial changes are quantified and shown in Fig. 6, N and O. Moreover, a full video reconstruction of the mucosa at 4 days into the recovery period is shown in Video 4.
Fig. 5.
DMI enabled novel visualization of dextran sulfate sodium (DSS)-induced injury of colorectal mucosa. DSS (3%) was administered to mice for 6 days, and the distalmost 1 cm of CDH1-immunostained colonic mucosa was luminally imaged at 0 (A), 2 (B), 4 (C), and 14 (D) days into the recovery period (after the removal of DSS). Regions lacking the red signal are CDH1-negative and devoid of intact epithelium; these regions represent ulcerations. The general locations of other features (restitution, neoepithelium, and aberrant crypt repair structures) are also indicated on these representative images. Clearing, SeeDB. Scale bars = 1,000 μm.
Fig. 6.
DMI captures reproducible epithelial structures during mucosal healing. A–D: restitutive and glandular changes are present at the boundary of ulceration, marked by the red edge of CDH1+ cells in A. Nuclei-only surface reconstruction and a deeper z plane are shown in B and C, both demonstrating the loss of crypt architecture. Separate digitally reconstructed orthogonal images show that the luminal openings of crypts are occluded by cells (D, *) and that these occluding cells are CDH1+ (E, *). F–I: aberrant crypt repair structures are prominent in late-stage recovery, as shown in surface (F) and subsurface (G) images. 3D projections (H) show that these structures provide a common luminal opening for collections of nascent crypts (exemplar crypts are marked with #), which is also demonstrated in the orthogonal image (I). J: surface reconstruction of morphologically normal crypts is shown for comparison. K–M: the most-distal colonic region was repaired with a neoepithelial sheet, which had a CDH1+ surface (K) and a subsurface structure resembling rete ridges (L). A single ridge is highlighted in the orthogonal image (M). N: the profile of ulceration could be recorded from multiple mice (colored lines) and averaged (black line); the results agreed with a general resealing of the epithelial surface by both more-proximal colonic and distal squamous-like epithelium. O: the average abundance of described structures changed over the time course of DSS recovery, with restitutive features being prominent early and aberrant crypts appearing late. Nos. on graph indicate average percent surface area ± SE for prominent (≥4%) epithelial features (n = 4 mice/cohort). Because of rounding, some nonzero error measurements are reported as 0. Scale bars: 200 (A–C), 100 (D and E), 200 (F and G), 100 (I), 200 (J), 200 (K and L), and 100 (M) μm. Clearing, SeeDB.
Ulceration and crypt loss.
Ulceration was evident as a loss of CDH1+ cells at the mucosal surface (Figs. 5 and 6, A–E). There were no glandular structures resembling crypts within the ulcerated region. The cells of the crypt-free region did not assemble into an obvious pattern. Ulceration was most pronounced at 2 and 4 days in the recovery period and had declined by 14 days. Within the very-distal region shown and analyzed, ulceration was first seen near the dentate line at 0 days recovery and had expanded to more-proximal areas at 2 days recovery (Fig. 5, A and B). The healing pattern was apparent at 4 days recovery, in that proximal regions were covered by restitutive colonic epithelium and the most-distal region by neoepithelium (Fig. 5C); this is quantitatively demonstrated in Fig. 6N as a reduction in ulceration at the edges of the profile.
Restitution.
At 2 and 4 days into the recovery period, mucosal regions containing CDH1+ cells harbored crypt-like structures; however, unlike normal crypts, the openings of these structures onto the luminal surface were occluded by CDH1+ cells (Fig. 6E). CDH1+ cells also extended from these crypt-like structures onto the surfaces of the ulcerated regions (Fig. 6, A–E and O). A simple explanation for these observations is that DSS exposure activates epithelial restitutive (migratory) behaviors that cover injured regions with a superficial layer of reparative cells.
Aberrant crypt repair structures.
These were prominent features of DSS-exposed mucosa at 14 days of recovery (Figs. 5D and 6O), and they could be qualitatively identified by their elongated openings onto the luminal surface (Fig. 6, F–I). Surface and basilar projections, shown in Fig. 6H, of the 3D-reconstructed structures highlighted their dissimilarity to normal crypts (Fig. 6J). Their elongated surface opening served to unify and bind multiple nascent crypts that budded from the base (Fig. 6H). In thin optical and orthogonal cross sections, aberrant crypt repair structures looked like aberrant crypt foci but lacked evidence of dysplasia (Fig. 6, G and I). Aberrant crypt repair structures were also seen in tissue examined after 4, 6, and 8 wk of recovery (n = 1 for each time point, data not shown), suggesting that some of them can be long-lived structures. We did not quantify their representation of the mucosal surface area at these later times. Aberrant crypt repair structures may be related to the so-called “wound channels” observed in biopsy models of colonic injury (28).
Neoepithelium.
A squamous-like, CDH1+ epithelium was consistently found adjacent to and proximal of the dentate line, beginning at 0 days into the recovery period (Fig. 5A), but was never found in normal colonic tissue. The colorectal surface area covered by this neoepithelium increased over time after recovery from DSS injury (Figs. 5, B–D, and 6O). Deeper imaging showed that the base of the squamous-like epithelium had structures that resembled rete ridges (rete pegs) (Fig. 6, K–M). This far-distal feature of colonic injury is rarely reported, but its origins may be related to the anal squamous epithelium (32).
Optical Reconstruction of Chronically Inflamed Colon
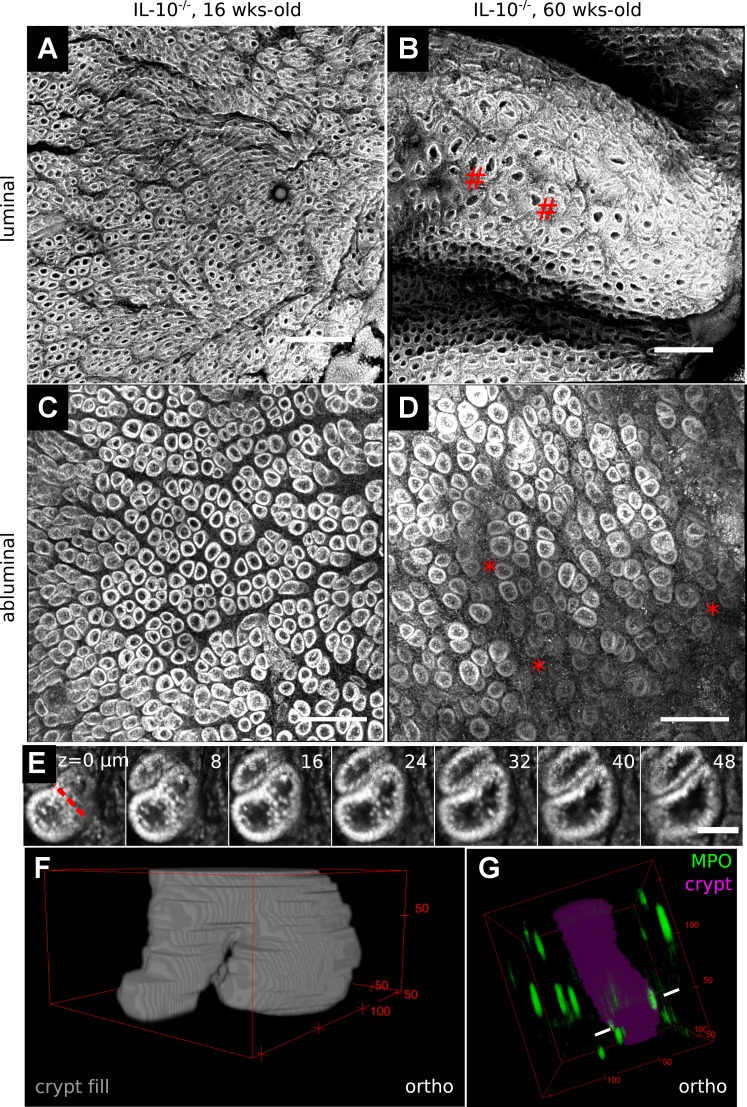
We analyzed colorectal mucosae obtained from a total of three IL-10−/− mice, a genetic inflammatory bowel disease (IBD) model characterized by spontaneous colitis that appears in the first several months of life and intensifies with age (21). Two mice were 60 wk old at dissection, and the other mouse was 16 wk old; these two ages roughly correspond to moderate and mild colitis, respectively, in our facility. No marked ulcerations or crypt abscesses were identified within the distalmost 1 cm of the examined colons (Video 5), consistent with limited epithelial damage reported for IL-10−/− mice maintained on the C57Bl/6 inbred background (3, 4, 14). However, in the 60-wk-old samples the rectal mucosa qualitatively exhibited small regions of crypt disfiguration accompanied by increased cellular number in the lamina propria (Fig. 7, A–D). Within these regions DMI simplified the identification and counting of crypt fission events (Fig. 7, E and F) similar to those observed in chronic ulcerative colitis (18). The 60-wk-old samples had local fission event densities of 3.4 and 2.3/mm2, while a spatially equivalent region in the 16-wk-old sample had a fission density of 0.3/mm2. Moreover, combining DMI with immunostaining for myeloperoxidase (MPO), a marker of neutrophils (41), provided 3D perspective on immune cells associated with colonic crypts (Fig. 7G) in these IL-10−/− specimens. Thus, DMI is suitable for the detailed analysis of mucosal structure in chronically inflamed colonic tissue.
Fig. 7.
DMI simplified identification of focal inflammatory changes in a murine colitis model. A–D: comparison of equivalent SeeDB-cleared distal regions in 16 (A and C)- and 60 (B and D)-wk-old IL-10−/− mice in both luminal (A and B) and abluminal (C and D) TO-PRO-3-stained (cellular nuclei-stained) image reconstructions highlighted regions of crypt dysmorphology (#) and increased intercrypt cellularity (*) in the 60-wk-old sample. E: depicted are serial z-sections from an abluminal image of a fissioning colonic crypt. The dashed red line marks the furrow at the crypt bases. Successive planes show that the crypts branch from a shared lumen. F: a fissioning crypt is shown in the 3D shape reconstruction. G: myeloperoxidase (MPO)+ neutrophils (pointed by white lines in highlighted crypt) were sporadically found throughout the crypt volume. Scale bars: 200 (A and B), 150 (C and D), and 50 (E) μm.
Visualizing Colonic Epithelial Dysplasia in Archived Specimen
To visualize crypt architecture in tumorigenesis, and to test whether DMI could reconstruct archived paraffin-embedded intestinal samples, we restored a distal colonic specimen from a single mouse subjected to the AOM-DSS polyposis model for 2 mo. In this model, polyp formation in distal colonic mucosa is accelerated by DSS injury in mice injected with the AOM mutagen (30, 38). After clearing, normal regions of colonic mucosa could be visualized in toto, indicating efficacy of SeeDB-based clearing of archived samples. Polyps could be imaged ∼160 μm deep with single-photon confocal microscopy; however, because of their thickness it was not possible to reconstruct them totally.
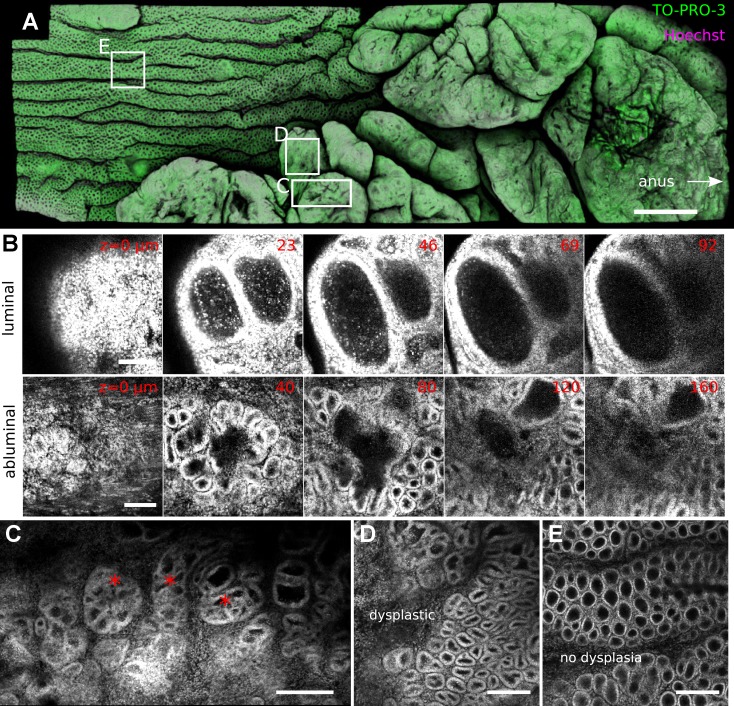
DMI enabled continuous examination of external structures at and internal structures near the tumor perimeter (Video 6). As shown in Fig. 8A, the tumor surface was observed to be multilobular. In contrast to normal colon, where numerous openings from the luminal surface led into crypts, the tumor surface was mostly sealed by a surface layer of cells, despite the crypt-like structures present underneath (Fig. 8B). Inside the tumor, crypt-like structures organized into aberrant crypt foci and adopted complex and variable structures (Fig. 8C). In abluminal images, distortion of nuclear shapes indicated high-grade dysplasia of crypt-like structures at the tumor base (Fig. 8, D and E). These images also qualitatively supported a thickening of the submucosal and stromal elements near the tumor (data not shown).
Fig. 8.
DMI improved the visualization of colorectal tumors. A: surface reconstruction of a SeeDB-cleared murine colonic polyp costained with 2 nuclear dyes (TO-PRO-3, Hoechst) in the azoxymethane (AOM)-DSS tumorigenesis model exhibits a tumor with multiple lobes. White boxes indicate areas of magnification. B: images of successive z planes in both luminal and abluminal images show the morphology of dysplastic crypt-like structures. C: aberrant crypt foci (*) could be located inside the tumor volume. D and E: dysplastic crypts qualitatively exhibited a thickened cellular boundary and altered shape (D) compared with nondysplastic crypts (E). Scale bars: 1,000 (A), 100 (B), 200 (C), and 150 (D and E) μm.
Use of DMI in Human Tissue
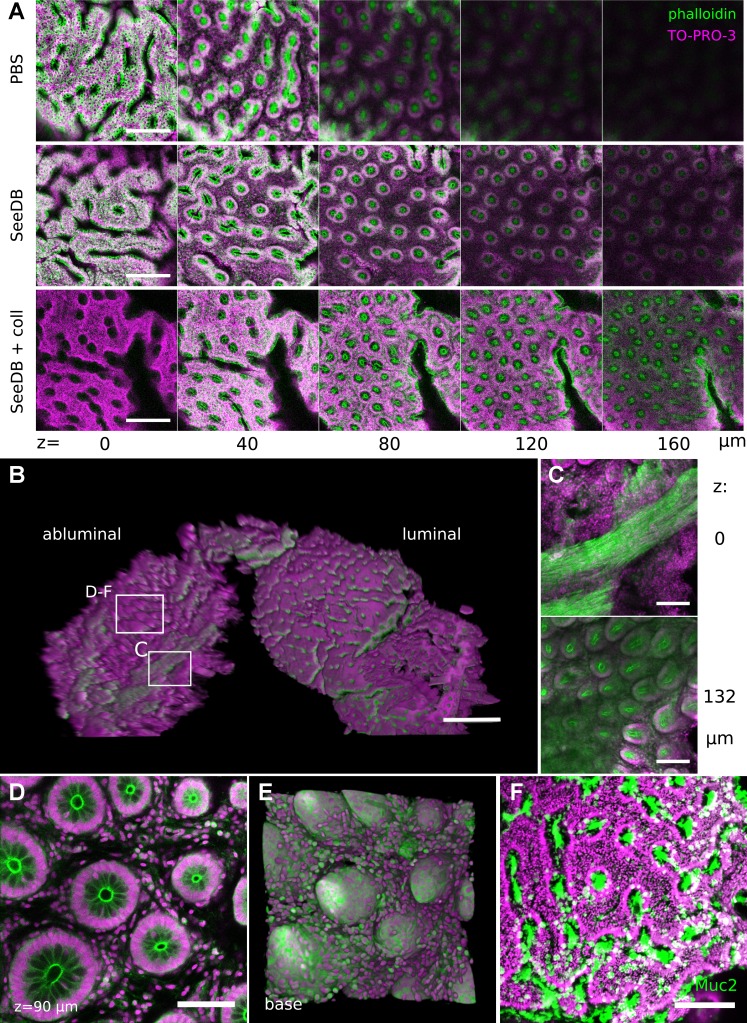
To determine whether DMI enhanced the analysis of human intestinal tissue, we obtained pinch biopsies from a fixed colonic pediatric surgical specimen. Although it did not fully clear the specimen, SeeDB treatment improved optical penetration and reconstruction of subsurface crypt structure (Video 7). Mild digestion of the tissue with collagenase further enhanced optical penetration but reduced the resolution at the mucosal surface (Fig. 9A). Similar to mouse colorectal tissue, biopsied crypts could be visualized in both luminal and abluminal orientations (Fig. 9B). Crypt bases could be examined through remnant submucosal and muscle layers (Fig. 9C). Cellular resolution could be obtained within the sample (Fig. 9D), and DMI allowed 3D reconstruction of the crypt base (Fig. 9E). Human colonic biopsies could be characterized by phalloidin staining for actin (Fig. 9, A–E) and by immunolabeling for the mucous protein and goblet cell marker MUC2 (Fig. 9F). Thus, DMI combined with exogenous dyes and antibodies generated a novel view of human colonic biopsies.
Fig. 9.
DMI provided a 3D view of human colonic biopsies. A: treatment of fixed human biopsy samples with SeeDB or SeeDB with collagenase improved optical penetration in luminal images. B: 3D projection shows the structure of a SeeDB-cleared biopsy sample, including both luminal and basilar planes. Boxes indicate regions highlighted. C: crypt structures were resolved through a layer of muscle in abluminal images. D and E: abluminal images permitted reconstruction of the crypt base in single z planes (D) and 3D basilar (E) shape displays. F: immunohistochemical staining for MUC2 could be performed to identify goblet cells on the luminal surface of human biopsies. Scale bars: 200 (A), 500 (B), 150 (C), 75 (D), and 150 (F) μm. TO-PRO-3 stained cellular nuclei; phalloidin-DyLight 488 stained actin filaments.
DISCUSSION
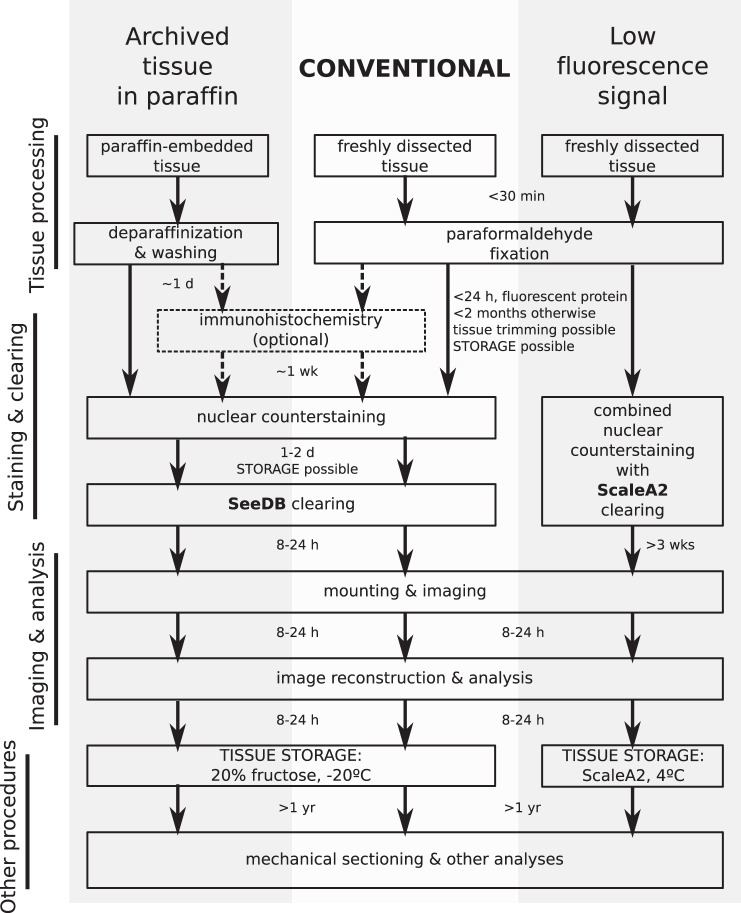
The colon has a central role in health and disease; thus, this organ serves as an excellent model for understanding biological phenomena through improved visualization of tissue architecture. We have developed a novel approach to generate extended volume representations of murine colorectal mucosa at cellular resolution. The combination of chemical clearing of colonic tissue, tiled 3D confocal imaging, and software routines enabled in toto visualization of epithelial changes during colonic injury, inflammation, and tumorigenesis. Structural information from DMI may be combined in the future with whole organ functional imaging [e.g., using activatable near-infrared probes that read inflammation (5, 10) or dysplasia (16)] to define precise tissue states in health and disease. While previous approaches for 3D imaging of intestinal tissue (1, 15, 36) have led to important discoveries (e.g., see Ref. 35), especially pertaining to epithelial stem cell renewal and differentiation, the DMI technique has key advantages. Compared with approaches that require mechanical sectioning (36), the DMI technique allows continuous observation of features across a larger x-y expanse of the mucosal surface. Thus, DMI is well suited for visualization of contiguous mucosal changes at length scales involving multiple colonic crypts and through the full crypt volume. In contrast to other methodologies (12, 15, 23, 34, 45), the DMI technique uses simple, low-cost reagents (e.g., urea, fructose) and obviates the need for tissue dehydration and shrinkage to achieve sufficient clearing. As shown in Figs. 1, 2, and 4, DMI allows native visualization of both cytoplasmic and membrane-targeted fluorescent proteins. DMI is readily incorporated into experimental workflows that require immunostaining, mechanical sectioning, and tissue archival and restoration (Fig. 10). The protocols and software of DMI are fully open, and because they can be performed with relatively standard single-photon confocal microscopes, they have reduced barriers to adoption. We believe these advantages will make DMI an important tool for the replicative imaging of specimens to understand biological processes, including inflammation and tumorigenesis, that are of clinical relevance.
Fig. 10.
Schematic of the DMI workflow. Most applications using freshly dissected mouse or human colonic tissue should follow the conventional workflow (center), which utilizes SeeDB as the clearing agent. However, if the expression of fluorescent proteins in the sample is low, ScaleA2 should be used as the clearing agent (right). Recovery and imaging of paraffin-embedded tissue involves deparaffinization and clearing with SeeDB (left). The arrows between steps indicate the amount of time needed by the previous step. Tissue can also be stored in 20% fructose or ScaleA2 after completion of certain steps, as shown on the diagram, for synchronous processing of experimental samples.
Limitations and Future Improvements
Advances in microscopy and tissue clearing may further improve the resolution, depth, and speed of the DMI technique.
Resolution.
With standard air objectives and single-photon excitation on a laser-scanning confocal microscope, we reconstructed colonic crypts at a minimum optical z-thickness of ∼2 μm, which is sufficient to resolve individual cellular nuclei but represents a relative loss of resolution through the crypt depth compared with techniques that mount the intestinal crypt on its side. The use of objectives that have longer working distances, higher NAs, and optimal performance at high refractive index will improve the z-resolution and accuracy of the DMI technique.
Depth.
While not required to reconstruct normal mouse colorectal mucosa, multiphoton excitation may help for deeper reconstruction of thick samples. Use of another clearing agent with distinct chemical properties may also help by providing better clearing. We have focused this study on ScaleA2 and SeeDB clearing agents, which provided enough clearing to reconstruct both myenteric and mucosal layers in murine midcolon but could not clear both layers sufficiently in distal colon, where the myenteric layer is thicker, hence motivating the manual removal of the myenteric layer in this protocol. We have successfully used the CUBIC reagents (37) to clear murine colorectal tissue (data not shown), but we do not have quantitative data comparing CUBIC with ScaleA2 or SeeDB in colon. Improvements in clearing will also help in the visualization of human colonic biopsies and tumor samples through their full depth.
Speed.
Faster image acquisition through light-sheet illumination (20, 40, 43), spinning-disk confocal imaging (8), or deconvolution microscopy (26) may aid in reconstruction of larger pieces of colon. Future parallel processing of images will likely accelerate image analysis.
Tips and Tricks
Several factors will need to be considered when deciding whether to use DMI and how best to apply it. DMI is well suited for addressing biological questions integrating over several length scales, for example, mechanisms of injury, inflammation, and tumorigenesis affecting multiple crypts that may be initiated by rare events or sparsely labeled cells such as stem cells. On a practical level we found that 3D reconstructions were easiest when imaging the native fluorescence of bright, genetically expressed fluorescent proteins, because the optical section thickness could be reduced while retaining signal and minimizing artifacts arising from inhomogeneous labeling by exogenous antibodies or dyes. Nonetheless it is very important to have a nucleus-labeling dye as a reference counterstain in DMI. All dyes and antibodies used must have high specificity for the target, otherwise they may be washed out during the clearing process or provide too much background. Because of lengthy and repeated illumination through the tissue volume, DMI demands that imaged proteins and dyes be photostable, which can be an issue for some nuclear labels and fluorescent proteins, although we have not encountered problems imaging EGFP or tdTomato. The selection of clearing agent is also important. When combining tissue clearing with other applications (e.g., immunohistochemistry), SeeDB provided more versatility and clearing speed; thus, SeeDB is a good “starter” reagent. However, in applications in which the expression of fluorescent proteins is weak, the tissue should be cleared with ScaleA2 to preserve the signals better. An alternative is to immunostain for the fluorescent protein and clear with SeeDB, but this requires additional optimization with antibodies. We prefer to test new experiments with SeeDB and only use ScaleA2 when the fluorescence preservation does not meet needs (Fig. 10). For the use of DMI in other gastrointestinal organs, the removal of highly scattering tissue, optimization of penetration of clearing agent, and development of a mounting setup will have to be performed to obtain an in toto view of the sample of interest. We anticipate that the visualization of macroscopic biological processes at continuous microscopic detail in 3D will open new levels of understanding of the molecular, cellular, and tissue relationships in the digestive tract.
GRANTS
This work was supported by the National Institutes of Health (R01-DK-056008 and R01-DK-066176). C. Y. Liu and P. E. Dubé were supported by postdoctoral fellowships from the California Institute for Regenerative Medicine (CIRM TG2-01168, CHLA Stem Cell Training Grant) and the Crohn's and Colitis Foundation of America, respectively.
DISCLOSURES
No conflicts of interest, financial or otherwise, are declared by the authors.
AUTHOR CONTRIBUTIONS
Author contributions: C.Y.L. and D.B.P. conception and design of research; C.Y.L., P.E.D., N.G., and A.T.R. performed experiments; C.Y.L. analyzed data; C.Y.L. and D.B.P. interpreted results of experiments; C.Y.L. prepared figures; C.Y.L. drafted manuscript; C.Y.L., P.E.D., and D.B.P. edited and revised manuscript; C.Y.L., P.E.D., N.G., A.T.R., and D.B.P. approved final version of manuscript.
ACKNOWLEDGMENTS
We thank S. Punit, R. Alhosh, J. K. Soh, G. E. Fernandez, T. C. Grikscheit, and D. S. Koos for technical assistance and helpful discussions.
REFERENCES
- 1.Appleton PL, Quyn AJ, Swift S, Näthke I. Preparation of wholemount mouse intestine for high-resolution three-dimensional imaging using two-photon microscopy. J Microsc 234: 196–204, 2009. [DOI] [PubMed] [Google Scholar]
- 2.Barker N, van Es JH, Kuipers J, Kujala P, van den Born M, Cozijnsen M, Haegebarth A, Korving J, Begthel H, Peters PJ, Clevers H. Identification of stem cells in small intestine and colon by marker gene Lgr5. Nature 449: 1003–1007, 2007. [DOI] [PubMed] [Google Scholar]
- 3.Berg DJ, Davidson N, Kühn R, Müller W, Menon S, Holland G, Thompson-Snipes L, Leach MW, Rennick D. Enterocolitis and colon cancer in interleukin-10-deficient mice are associated with aberrant cytokine production and CD4(+) TH1-like responses. J Clin Invest 98: 1010–1020, 1996. [DOI] [PMC free article] [PubMed] [Google Scholar]
- 4.Bristol IJ, Farmer MA, Cong Y, Zheng XX, Strom TB, Elson CO, Sundberg JP, Leiter EH. Heritable susceptibility for colitis in mice induced by IL-10 deficiency. Inflamm Bowel Dis 6: 290–302, 2000. [DOI] [PubMed] [Google Scholar]
- 5.Cattaruzza F, Lyo V, Jones E, Pham D, Hawkins J, Kirkwood K, Valdez-Morales E, Ibeakanma C, Vanner SJ, Bogyo M, Bunnett NW. Cathepsin S is activated during colitis and causes visceral hyperalgesia by a PAR2-dependent mechanism in mice. Gastroenterology 141: 1864–1874, 2011. [DOI] [PMC free article] [PubMed] [Google Scholar]
- 6.Chung K, Wallace J, Kim SY, Kalyanasundaram S, Andalman AS, Davidson TJ, Mirzabekov JJ, Zalocusky KA, Mattis J, Denisin AK, Pak S, Bernstein H, Ramakrishnan C, Grosenick L, Gradinaru V, Deisseroth K. Structural and molecular interrogation of intact biological systems. Nature 497: 332–337, 2013. [DOI] [PMC free article] [PubMed] [Google Scholar]
- 7.Clendenon SG, Young PA, Ferkowicz M, Phillips C, Dunn KW. Deep tissue fluorescent imaging in scattering specimens using confocal microscopy. Microsc Microanal 17: 614–617, 2011. [DOI] [PMC free article] [PubMed] [Google Scholar]
- 8.Conchello JA, Lichtman JW. Optical sectioning microscopy. Nat Methods 2: 920–931, 2005. [DOI] [PubMed] [Google Scholar]
- 9.Davidson LA, Goldsby JS, Callaway ES, Shah MS, Barker N, Chapkin RS. Alteration of colonic stem cell gene signatures during the regenerative response to injury. Biochim Biophys Acta 1822: 1600–1607, 2012. [DOI] [PMC free article] [PubMed] [Google Scholar]
- 10.Ding S, Blue RE, Morgan DR, Lund PK. Comparison of multiple enzyme activatable near-infrared fluorescent molecular probes for detection and quantification of inflammation in murine colitis models. Inflamm Bowel Dis 20: 363–377, 2014. [DOI] [PMC free article] [PubMed] [Google Scholar]
- 11.Dubé PE, Yan F, Punit S, Girish N, McElroy SJ, Washington MK, Polk DB. Epidermal growth factor receptor inhibits colitis-associated cancer in mice. J Clin Invest 122: 2780–2792, 2012. [DOI] [PMC free article] [PubMed] [Google Scholar]
- 12.Ertürk A, Bradke F. High-resolution imaging of entire organs by 3-dimensional imaging of solvent cleared organs (3DISCO). Exp Neurol 242: 57–64, 2013. [DOI] [PubMed] [Google Scholar]
- 13.Ertürk A, Mauch CP, Hellal F, Förstner F, Keck T, Becker K, Jährling N, Steffens H, Richter M, Hübener M, Kramer E, Kirchhoff F, Dodt HU, Bradke F. Three-dimensional imaging of the unsectioned adult spinal cord to assess axon regeneration and glial responses after injury. Nat Med 18: 166–171, 2012. [DOI] [PubMed] [Google Scholar]
- 14.Farmer MA, Sundberg JP, Bristol IJ, Churchill GA, Li R, Elson CO, Leiter EH. A major quantitative trait locus on chromosome 3 controls colitis severity in IL-10-deficient mice. Proc Natl Acad Sci USA 98: 13820–13825, 2001. [DOI] [PMC free article] [PubMed] [Google Scholar]
- 15.Fu YY, Lin CW, Enikolopov G, Sibley E, Chiang AS, Tang SC. Microtome-free 3-dimensional confocal imaging method for visualization of mouse intestine with subcellular-level resolution. Gastroenterology 137: 453–465, 2009. [DOI] [PMC free article] [PubMed] [Google Scholar]
- 16.Gounaris E, Martin J, Ishihara Y, Khan MW, Lee G, Sinh P, Chen EZ, Angarone M, Weissleder R, Khazaie K, Barrett TA. Fluorescence endoscopy of cathepsin activity discriminates dysplasia from colitis. Inflamm Bowel Dis 19: 1339–1345, 2013. [DOI] [PMC free article] [PubMed] [Google Scholar]
- 17.Hama H, Kurokawa H, Kawano H, Ando R, Shimogori T, Noda H, Fukami K, Sakaue-Sawano A, Miyawaki A. Scale: a chemical approach for fluorescence imaging and reconstruction of transparent mouse brain. Nat Neurosci 14: 1481–1488, 2011. [DOI] [PubMed] [Google Scholar]
- 18.Humphries A, Wright NA. Colonic crypt organization and tumorigenesis. Nat Rev Cancer 8: 415–424, 2008. [DOI] [PubMed] [Google Scholar]
- 19.Ke MT, Fujimoto S, Imai T. SeeDB: a simple and morphology-preserving optical clearing agent for neuronal circuit reconstruction. Nat Neurosci 16: 1154–1161, 2013. [DOI] [PubMed] [Google Scholar]
- 20.Keller PJ, Schmidt AD, Wittbrodt J, Stelzer EHK. Reconstruction of zebrafish early embryonic development by scanned light sheet microscopy. Science 322: 1065–1069, 2008. [DOI] [PubMed] [Google Scholar]
- 21.Kühn R, Löhler J, Rennick D, Rajewsky K, Müller W. Interleukin-10-deficient mice develop chronic enterocolitis. Cell 75: 263–274, 1993. [DOI] [PubMed] [Google Scholar]
- 22.Linkert M, Rueden CT, Allan C, Burel JM, Moore W, Patterson A, Loranger B, Moore J, Neves C, Macdonald D, Tarkowska A, Sticco C, Hill E, Rossner M, Eliceiri KW, Swedlow JR. Metadata matters: access to image data in the real world. J Cell Biol 189: 777–782, 2010. [DOI] [PMC free article] [PubMed] [Google Scholar]
- 23.Liu YA, Pan ST, Hou YC, Shen MY, Peng SJ, Tang SC, Chung YC. 3-D visualization and quantitation of microvessels in transparent human colorectal carcinoma. PLoS One 8: e81857, 2013. [DOI] [PMC free article] [PubMed] [Google Scholar]
- 24.Lopez-Garcia C, Klein AM, Simons BD, Winton DJ. Intestinal stem cell replacement follows a pattern of neutral drift. Science 330: 822–825, 2010. [DOI] [PubMed] [Google Scholar]
- 25.Madisen L, Zwingman TA, Sunkin SM, Oh SW, Zariwala HA, Gu H, Ng LL, Palmiter RD, Hawrylycz MJ, Jones AR, Lein ES, Zeng H. A robust and high-throughput Cre reporting and characterization system for the whole mouse brain. Nat Neurosci 13: 133–140, 2010. [DOI] [PMC free article] [PubMed] [Google Scholar]
- 26.McNally JG, Karpova T, Cooper J, Conchello JA. Three-dimensional imaging by deconvolution microscopy. Methods 19: 373–385, 1999. [DOI] [PubMed] [Google Scholar]
- 27.Metcalfe C, Kljavin NM, Ybarra R, de Sauvage FJ. Lgr5(+) stem cells are indispensable for radiation-induced intestinal regeneration. Cell Stem Cell 14: 149–159, 2014. [DOI] [PubMed] [Google Scholar]
- 28.Miyoshi H, Ajima R, Luo CT, Yamaguchi TP, Stappenbeck TS. Wnt5a potentiates TGF-β signaling to promote colonic crypt regeneration after tissue injury. Science 338: 108–113, 2012. [DOI] [PMC free article] [PubMed] [Google Scholar]
- 29.Muzumdar MD, Tasic B, Miyamichi K, Li L, Luo L. A global double-fluorescent Cre reporter mouse. Genesis 45: 593–605, 2007. [DOI] [PubMed] [Google Scholar]
- 30.Neufert C, Becker C, Neurath MF. An inducible mouse model of colon carcinogenesis for the analysis of sporadic and inflammation-driven tumor progression. Nat Protoc 2: 1998–2004, 2007. [DOI] [PubMed] [Google Scholar]
- 31.Okayasu I, Hatakeyama S, Yamada M, Ohkusa T, Inagaki Y, Nakaya R. A novel method in the induction of reliable experimental acute and chronic ulcerative colitis in mice. Gastroenterology 98: 694–702, 1990. [DOI] [PubMed] [Google Scholar]
- 32.Perše M, Cerar A. Dextran sodium sulphate colitis mouse model: traps and tricks (Abstract). J Biomed Biotechnol 2012: 718617, 2012. [DOI] [PMC free article] [PubMed] [Google Scholar]
- 33.Preibisch S, Saalfeld S, Tomancak P. Globally optimal stitching of tiled 3D microscopic image acquisitions. Bioinformatics 25: 1463–1465, 2009. [DOI] [PMC free article] [PubMed] [Google Scholar]
- 34.Scott GD, Blum ED, Fryer AD, Jacoby DB. Tissue optical clearing, three-dimensional imaging, and computer morphometry in whole mouse lungs and human airways. Am J Respir Cell Mol Biol 51: 43–55, 2014. [DOI] [PMC free article] [PubMed] [Google Scholar]
- 35.Snippert HJ, van der Flier LG, Sato T, van Es JH, van den Born M, Kroon-Veenboer C, Barker N, Klein AM, van Rheenen J, Simons BD, Clevers H. Intestinal crypt homeostasis results from neutral competition between symmetrically dividing Lgr5 stem cells. Cell 143: 134–144, 2010. [DOI] [PubMed] [Google Scholar]
- 36.Snippert HJ, Schepers AG, Delconte G, Siersema PD, Clevers H. Slide preparation for single-cell-resolution imaging of fluorescent proteins in their three-dimensional near-native environment. Nat Protoc 6: 1221–1228, 2011. [DOI] [PubMed] [Google Scholar]
- 37.Susaki EA, Tainaka K, Perrin D, Kishino F, Tawara T, Watanabe TM, Yokoyama C, Onoe H, Eguchi M, Yamaguchi S, Abe T, Kiyonari H, Shimizu Y, Miyawaki A, Yokota H, Ueda HR. Whole-brain imaging with single-cell resolution using chemical cocktails and computational analysis. Cell 157: 726–739, 2014. [DOI] [PubMed] [Google Scholar]
- 38.Tanaka T, Kohno H, Suzuki R, Yamada Y, Sugie S, Mori H. A novel inflammation-related mouse colon carcinogenesis model induced by azoxymethane and dextran sodium sulfate. Cancer Sci 94: 965–973, 2003. [DOI] [PMC free article] [PubMed] [Google Scholar]
- 39.Tian H, Biehs B, Warming S, Leong KG, Rangell L, Klein OD, de Sauvage FJ. A reserve stem cell population in small intestine renders Lgr5-positive cells dispensable. Nature 478: 255–259, 2011. [DOI] [PMC free article] [PubMed] [Google Scholar]
- 40.Truong TV, Supatto W, Koos DS, Choi JM, Fraser SE. Deep and fast live imaging with two-photon scanned light-sheet microscopy. Nat Methods 8: 757–760, 2011. [DOI] [PubMed] [Google Scholar]
- 41.Van Leeuwen M, Gijbels MJJ, Duijvestijn A, Smook M, van de Gaar MJ, Heeringa P, de Winther MPJ, Tervaert JWC. Accumulation of myeloperoxidase-positive neutrophils in atherosclerotic lesions in LDLR−/− mice. Arterioscler Thromb Vasc Biol 28: 84–89, 2008. [DOI] [PubMed] [Google Scholar]
- 42.Vermeulen L, Morrissey E, van der Heijden M, Nicholson AM, Sottoriva A, Buczacki S, Kemp R, Tavaré S, Winton DJ. Defining stem cell dynamics in models of intestinal tumor initiation. Science 342: 995–998, 2013. [DOI] [PubMed] [Google Scholar]
- 43.Verveer PJ, Swoger J, Pampaloni F, Greger K, Marcello M, Stelzer EHK. High-resolution three-dimensional imaging of large specimens with light sheet-based microscopy. Nat Methods 4: 311–313, 2007. [DOI] [PubMed] [Google Scholar]
- 44.Yang B, Treweek JB, Kulkarni RP, Deverman BE, Chen CK, Lubeck E, Shah S, Cai L, Gradinaru V. Single-cell phenotyping within transparent intact tissue through whole-body clearing. Cell 158: 945–958, 2014. [DOI] [PMC free article] [PubMed] [Google Scholar]
- 45.Zhu D, Larin KV, Luo Q, Tuchin VV. Recent progress in tissue optical clearing. Laser Photon Rev 7: 732–757, 2013. [DOI] [PMC free article] [PubMed] [Google Scholar]


